


胖企鹅 price history
 Download Data(.CSV)
| Date | Open* | High | Low | Close** | Volume |
|---|

On this day
 Today$0.002505







Download 胖企鹅 price historical data
胖企鹅 candlestick data
(1 minute-candlestick)Free Download胖企鹅 Historical Data
Download Data(.CSV)

About 胖企鹅 Price History Data
胖企鹅 price history tracking allows crypto investors to easily monitor the performance of their investment. You can conveniently track the opening value, high, and close for 胖企鹅 over time, as well as the trade volume. Additionally, you can instantly view the daily change as a percentage, making it effortless to identify days with significant fluctuations.
According to our 胖企鹅 price history data, its value soared to an unprecedented peak in 2026-08-13, surpassing -- USD.On the other hand, the lowest point in 胖企鹅's price trajectory, commonly referred to as the "胖企鹅 all-time low", occurred on 2026-08-13.If one had purchased 胖企鹅 during that time, they would currently enjoy a remarkable profit of 0%.
By design, 999,999,959.81 胖企鹅 will be created. As of now, the circulating supply of 胖企鹅 is approximately 999,999,940.
All the prices listed on this page are obtained from Bitget, a reliable source. It is crucial to rely on a single source to check your investments, as values may vary among different sellers.
Our historical 胖企鹅 price dataset includes data at intervals of 1 minute, 1 day, 1 week, and 1 month (open/high/low/close/volume). These datasets have undergone rigorous testing to ensure consistency, completeness, and accuracy. They are specifically designed for trade simulation and backtesting purposes, readily available for free download, and updated in real-time.
胖企鹅 Historical Data Use Cases
Here are some of the ways 胖企鹅 historical data is used in 胖企鹅 trading:
With these tools and resources, traders can delve into 胖企鹅's historical data, gain valuable insights, and potentially enhance their trading strategies.
How to read 胖企鹅 candlestick data

胖企鹅 candlestick charts show time across the horizontal axis and price data on the vertical axis, just like line and bar graphs. Candlesticks may have two different colors: green or red. Green candles show that the price went up over the period under consideration, while red candles show that the price declined.
The simple structure of candlesticks can offer users a lot of information. Technical analysts may use candlestick patterns to, for example, identify potential trend reversals.
Based on 胖企鹅 historical data, when the 胖企鹅 market exhibits a bearish or bullish trend, conservative investors may opt to use principal-guaranteed products like Smart Trend, Snowball, or Shark Fin to take advantage of the prevailing trend.
Conversely, more aggressive investors may pursue higher returns by investing in non-principal-guaranteed products such as Range Sniper or employing Dual Investment products based on their market direction judgments.
In the case of a sideways market for 胖企鹅, utilizing Range Sniper and selecting bullish products to exploit a slight upward trend or bearish products to capitalize on a modest bearish trend may potentially result in improved performance.
To enhance your understanding of profiting from a bullish market trend, you are advised to delve into resources that cover the Bull market support band band and Range Sniper.
Additionally, reading articles on Profiting from bear markets and the The ultimate bear market strategy can provide you with a deeper grasp of these concepts.
FAQ
What is crypto historical data?
Historical Data refers to past information related to cryptocurrencies such as 胖企鹅, Ethereum, and others. This data encompasses a wide range of metrics, including price, trading volume, market capitalization, and more.
The significance of crypto historical data lies in its multiple applications within crypto trading. Primarily, it empowers traders and investors to make well-informed choices by gaining a comprehensive understanding of the past performance exhibited by the crypto market.
How to get crypto historical data
There are multiple methods to obtain historical crypto data, but some options have drawbacks. For instance, searching for the ticker of the desired crypto on platforms like Google Finance or Yahoo Finance can be challenging to import into Excel. Additionally, using web scraping techniques may lead to issues such as potential bans and unreliable data retrieval.
To ensure accuracy and reliability, the most recommended approach is to directly download the data from reputable cryptocurrency exchanges like Bitget, Binance, or CoinMarketCap. This allows for seamless integration into your Excel spreadsheet, providing a trustworthy source of historical crypto data.
Benefits of downloading crypto historical data on Bitget
In late 2023, we recognized the need for a centralized platform for cryptocurrency data research. With a long-standing reputation for reliable data, we have been providing FREE access to historical cryptocurrency data for quite some time.As a result, we have become the go-to platform for users seeking comprehensive and accurate information on cryptocurrency markets.
By downloading the historical data available on Bitget, you not only gain access to a wealth of information but also benefit from our expertise in tracking and analyzing cryptocurrency market risks. This data can serve as a valuable starting point for your own personal research or analysis. Feel free to utilize the historical data we offer to enhance your understanding of the cryptocurrency landscape.
What is the format of historical data?
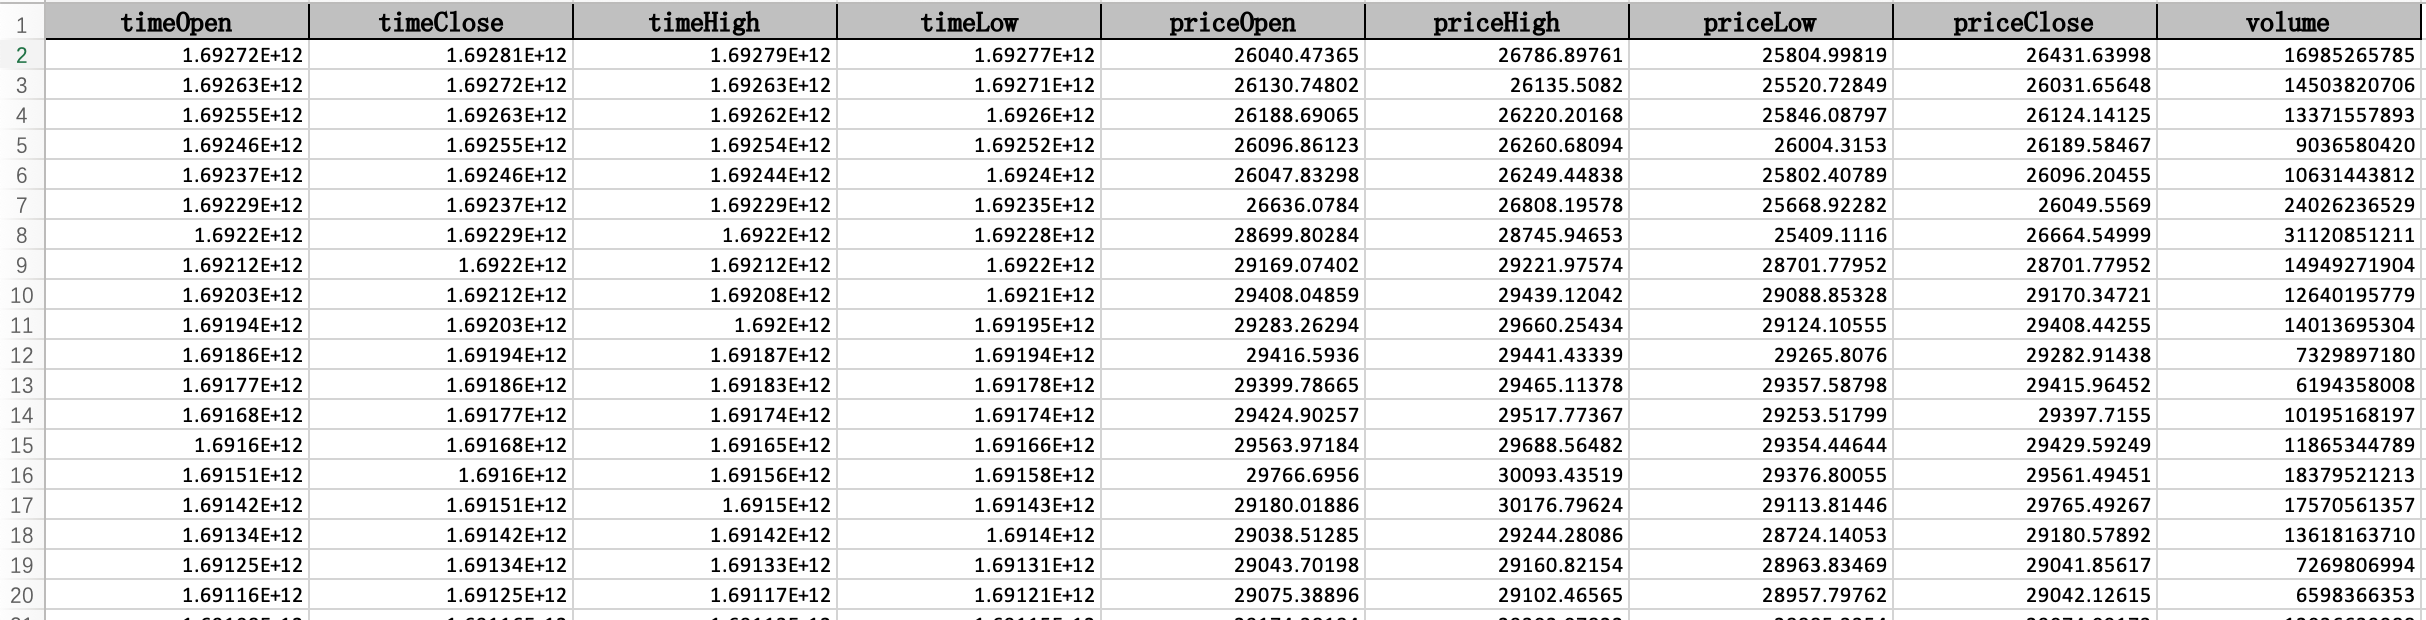
You can download crypto historical data sheets instantly with just one click. The data is provided in an Excel file. If you need to convert the data into a different format (e.g., CSV -> JSON), we recommend ConvertCSV. Screenshot:
What is the update frequency of historical data?
Our crypto prices historical data is updated on a daily basis, similar to how markets are typically updated once a trading day concludes.
In which timezone is historical data displayed?
All our historical data is provided in the GMT+0 time zone.
Why do I get a "frequency too high" error when I click the download button?
To prevent abuse, data for each coin can only be downloaded once per day. Please try again on the following day.