Market data tracked by Bloomberg Intelligence is highlighting a widening divergence between metals and crypto assets as volatility dynamics shift heading into 2026, according to recent analysis shared by Bloomberg Intelligence strategist Mike McGlone. Two separate datasets focus on relative performance trends, linking asset behavior to equity market volatility rather than speculative momentum.
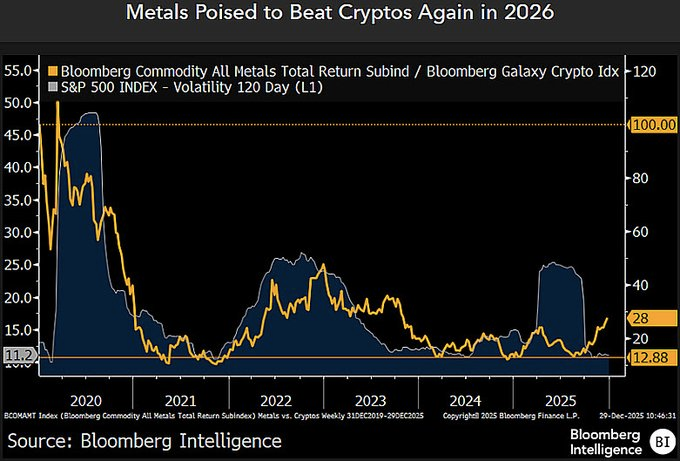
A chart titled “Metals Poised to Beat Cryptos Again in 2026” compares the Bloomberg Commodity All Metals Total Return Subindex with the Bloomberg Galaxy Crypto Index, alongside 120-day volatility in the S&P 500. The data shows metals experiencing gains and heightened volatility around 2020, followed by a downturn into 2021.
 Source:
By contrast, the crypto index displays wider price swings throughout the period, with strong peaks and declines that align with changes in equity market volatility. Moving into 2024 and early 2025, metals appear comparatively stable, showing smaller fluctuations than in prior cycles. Crypto performance, however, reflects renewed volatility spikes during the same timeframe.
According to Bloomberg Intelligence, these patterns resemble earlier periods when metals outperformed crypto assets during episodes of tighter financial conditions or increased uncertainty. The data presentation suggests that if equity volatility remains elevated, metals may continue to exhibit relative resilience compared to crypto markets.
Related: Rich Dad Author Warns Against “Fake Government Money,” Recommends BTC and Metals
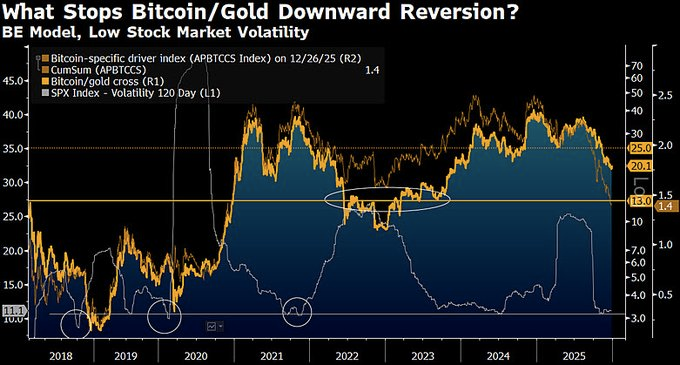
A second chart focuses on the relationship between Bitcoin and Gold, examining the Bitcoin-to-gold ratio alongside stock market volatility and a proprietary valuation framework. Titled “What Stops Bitcoin/Gold Downward Reversion? BE Model, Low Stock Market Volatility,” the chart places the ratio near 20x as of Dec. 29, with a modeled trajectory toward 13x based on inputs from Bloomberg Economics.
 Source:
Historical data in the chart shows that periods of low equity volatility have coincided with stabilization or recovery in the Bitcoin-to-gold ratio, notably between 2018 and 2020 and again during 2022–2023. Conversely, spikes in volatility have aligned with downward pressure on the ratio.
(adsbygoogle = window.adsbygoogle || []).push({});Into early 2025, the ratio shows renewed decline as volatility readings increase. Bloomberg Intelligence frames the data as proof that equity market volatility remains a key variable influencing relative performance between digital assets and metals, based solely on the historical relationships presented in the charts.
Related:Bitcoin vs Gold & Silver: Which One Wins Over Investors in the 2025 Hard Money Race?