XRP Price Positive Streak Fades—Are Traders Bracing for Volatility?

XRP price started a decent increase above $2.150. The price is now correcting gains and might struggle to stay in a positive zone.
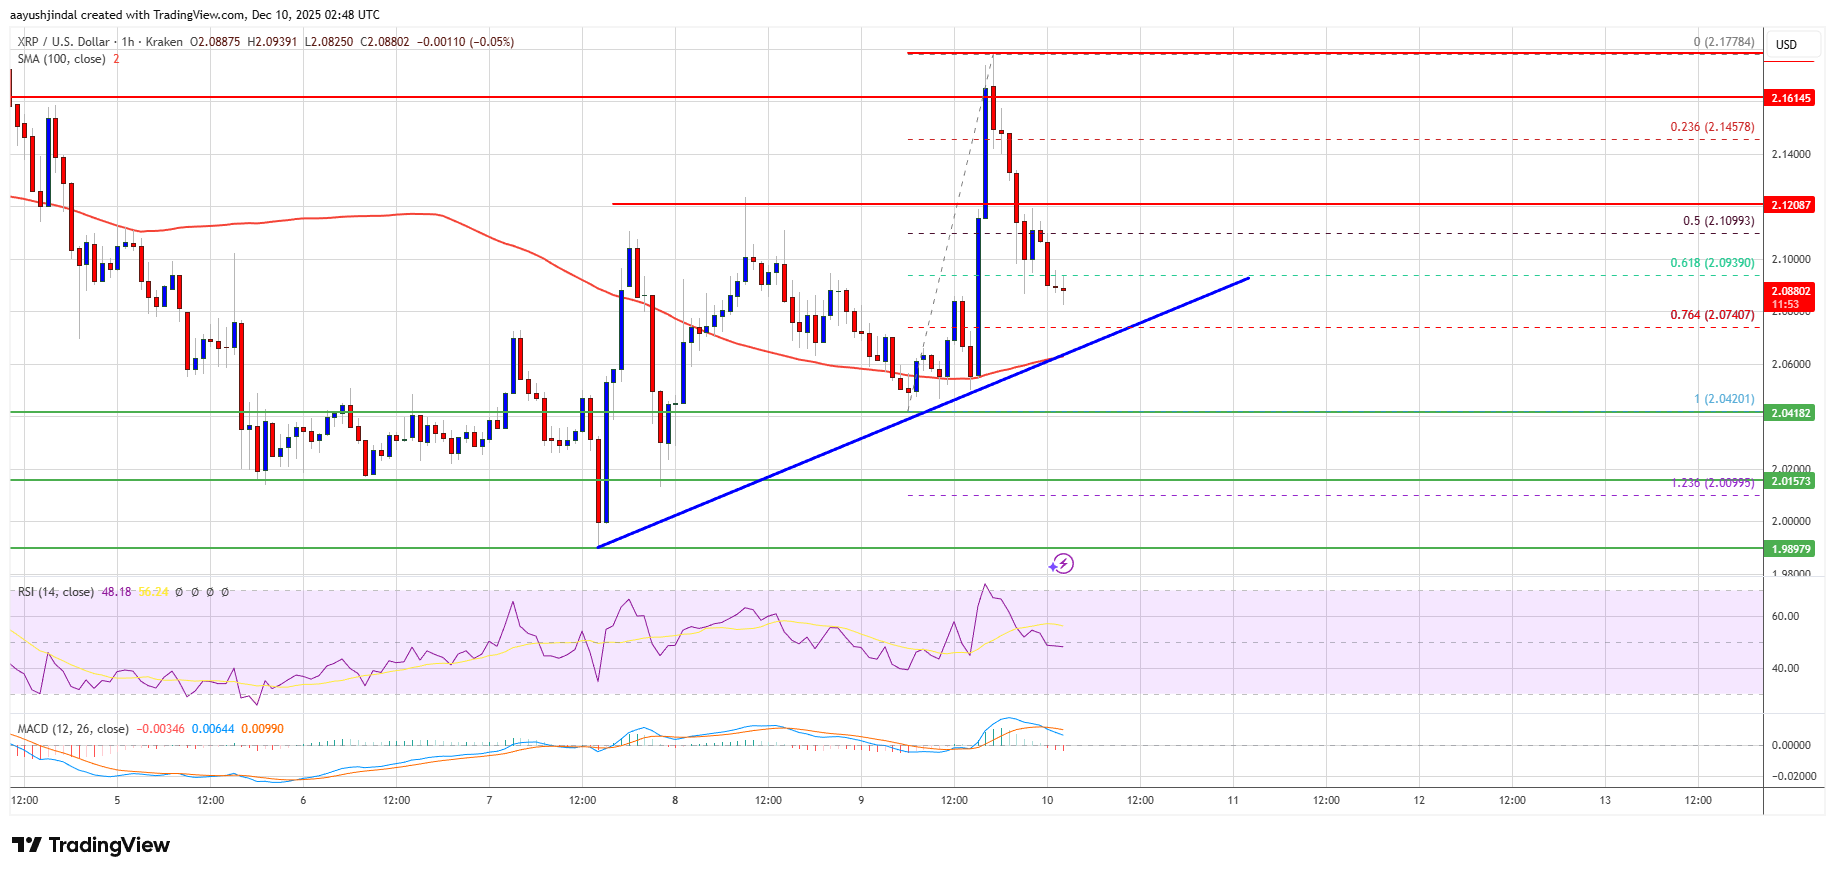
- XRP price started a downside correction and tested the $2.080 zone.
- The price is now trading above $2.050 and the 100-hourly Simple Moving Average.
- There is a bullish trend line forming with support at $2.070 on the hourly chart of the XRP/USD pair (data source from Kraken).
- The pair could start another increase if it clears $2.120.
XRP Price Dips Again
XRP price started a downside correction from the $2.180 zone, like Bitcoin and Ethereum. The price dipped below the $2.150 and $2.120 levels to enter a consolidation phase.
The price even dipped below the 50% Fib retracement level of the upward move from the $2.042 swing low to the $2.1778 high. However, the bulls remained active above the $2.080 support. There is also a bullish trend line forming with support at $2.070 on the hourly chart of the XRP/USD pair.
The price is now trading above $2.050 and the 100-hourly Simple Moving Average. If there is a fresh upward move, the price might face resistance near the $2.120 level.
The first major resistance is near the $2.150 level, above which the price could rise and test $2.180. A clear move above the $2.180 resistance might send the price toward the $2.2250 resistance. Any more gains might send the price toward the $2.250 resistance. The next major hurdle for the bulls might be near $2.2880.
More Losses?
If XRP fails to clear the $2.120 resistance zone, it could start a fresh decline. Initial support on the downside is near the $2.070 level, the 76.4% Fib retracement level of the upward move from the $2.042 swing low to the $2.1778 high, and the trend line. The next major support is near the $2.050 level.
If there is a downside break and a close below the $2.050 level, the price might continue to decline toward $2.00. The next major support sits near the $1.9850 zone, below which the price could continue lower toward $1.920.
Technical Indicators
Hourly MACD – The MACD for XRP/USD is now gaining pace in the bearish zone.
Hourly RSI (Relative Strength Index) – The RSI for XRP/USD is now below the 50 level.
Major Support Levels – $2.070 and $2.050.
Major Resistance Levels – $2.120 and $2.180.
Disclaimer: The content of this article solely reflects the author's opinion and does not represent the platform in any capacity. This article is not intended to serve as a reference for making investment decisions.
You may also like
Bitcoin Experiences Steep Drop: What Causes the Sudden Sell-Off?
- Bitcoin plummeted 30% in November 2025, erasing $1 trillion in market cap amid macroeconomic pressures and institutional profit-taking. - Central bank uncertainty (Fed, ECB) and leveraged liquidations amplified the selloff, with ETF outflows exceeding $3.79 billion. - Bitcoin's 0.90 correlation with the S&P 500 highlighted its shift from "digital gold" to risk-on asset, contrasting gold's 55% surge. - On-chain metrics revealed structural weaknesses: hash rate declines, miner revenue drops, and divergent

PENGU USDT Sell Alert and Stablecoin Price Fluctuations: Evaluating Algorithmic Dangers Amid Changing Cryptocurrency Markets
- PENGU USDT's 2025 volatility reignited debates on algorithmic stablecoin fragility amid regulatory uncertainty and post-UST market skepticism. - Technical analysis showed conflicting signals: overbought MFI vs bearish RSI divergence, with critical support/resistance levels at $0.010-$0.013. - $66.6M team wallet outflows and 32% open interest growth highlighted liquidity risks, while UST's collapse legacy exposed algorithmic design flaws. - Investors increasingly favor fiat-backed alternatives like USDC ,
HYPE Token Experiences Rapid Growth in December 2025: Evaluating Authenticity and Investment Opportunities Amidst an Unstable Post-ETF Cryptocurrency Landscape
- HYPE token surged in Dec 2025 amid post-Bitcoin ETF crypto optimism , raising questions about its investment legitimacy. - Hyperliquid's 72.7% decentralized trading volume share and $106M monthly revenue highlight its DeFi infrastructure strength. - Institutional backing from Paradigm and a $1B DAT fund signals confidence, though major exchange listings remain pending. - Price volatility, token unlocks, and mixed expert opinions underscore risks, with potential $53–$71 targets contingent on market condit
LUNA Falls by 5.77% Over 24 Hours Despite Fluctuating Medium-Term Performance
- LUNA fell 5.77% in 24 hours to $0.1512, but rose 47.52% in 7 days and 105.96% in 30 days. - However, it still faces a 64.14% annual loss, highlighting crypto market volatility and long-term risks for investors. - The price swing reflects sensitivity to macroeconomic shifts and sentiment, with analysts noting ongoing uncertainty in forecasts. - Investors are weighing recent resilience against regulatory challenges and institutional behavior shifts, monitoring if the drop signals a bearish trend or tempora