Bitcoin Bulls Eye $94K Breakout Ahead of Crucial FOMC Rate Cut Decision

Bitcoin Price Weekly Outlook
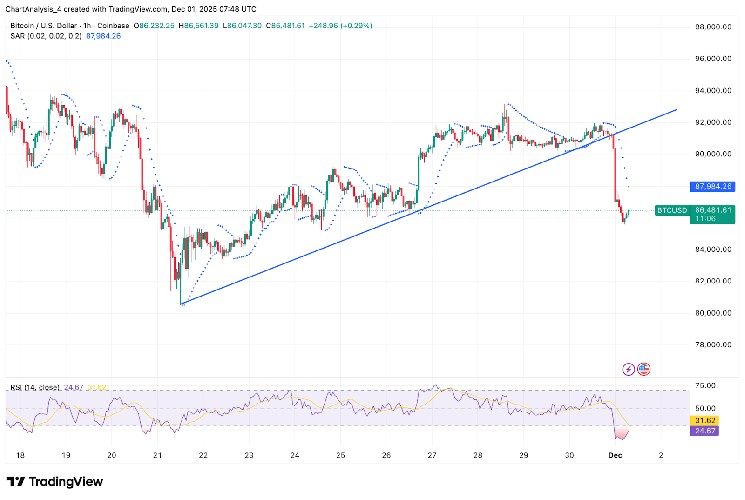
Last week was a bit of a roller coaster ride, while bears kicked the price down to the $84,000 support level early in the week, bulls stepped in down there to rally the price up to the $94,000 resistance level. From there, the price dropped once again, just below $88,000 on Sunday morning, before seeing a small rally to close the week out at $90,429. This week, bitcoin bulls will look to the FOMC meeting on Wednesday to produce a much-anticipated rate cut to help facilitate a better investment environment for bitcoin and other assets. Climbing above $94,000 will be key for the bulls this week, if they hope to sway the market more in their favor.
Key Support and Resistance Levels Now
Bitcoin closed the week as a doji candle on Sunday, indicating indecision between buyers and sellers. The short-term outlook is slightly in the bulls’ favor, who will look to conquer the $94,000 resistance level. If they can establish this level as support, they will look to $101,000 as the next major resistance level, with sellers likely to begin slowing momentum down above $96,000. Beyond $101,000, we look to $104,000 and then a resistance zone between $107,000 and $110,000. Resistance gets very thick above $100,000.
Looking down to support levels, bulls will want to see $87,200 hold any daily closes to avoid another test of the $84,000 support level below. Any further touches of $84,000 will weaken it and make it less likely to remain in place as a floor. There is a $72,000 to $68,000 support zone, which will look to buoy the price below here. Below $68,000 would likely see the price chop around some, but look to hang onto the 0.618 Fibonacci retracement at $57,700. It is unlikely we would test this lower level for at least several weeks, though, if it even comes.

Outlook For This Week
Short-term momentum slightly favors the bulls early this week. The relative strength index (RSI) on the daily chart is showing some positive progress, generating higher highs off the 13 SMA support. This week, bulls will look for the 13 SMA to continue to act as support and help push the RSI above 60 into bullish territory. As long as bulls can remain above support levels heading into Wednesday’s FOMC meeting, they have a chance to tackle higher levels on a rate cut. If the FOMC meeting surprises everyone with no rate cut announcement, expect $84,000 support to fail.
Market mood: Very Bearish – Bulls have managed to put in a small rally here over the prior two weeks, but the price action has been lackluster and is still favoring the bears.
The next few weeks
The bearish cross in place on the monthly MACD oscillator will continue to weigh on price throughout December and likely into January as well, barring any major moves up in price to undo it. Bitcoin price will need to continue to climb higher and maintain closes above the 100-week simple moving average (SMA), which sits at $84,700 heading into this week. Even if bulls can manage to keep momentum going over the coming weeks, there is heavy resistance sitting at $110,000 and above, and the price is very likely to pull back from that level (or lower) on the weekly chart. Doing so would put in a convincing lower high on the weekly chart and provide the bears with renewed conviction on a longer-term top being in place.
Terminology Guide:
Bulls/Bullish: Buyers or investors expecting the price to go higher.
Bears/Bearish: Sellers or investors expecting the price to go lower.
Support or support level: A level at which the price should hold for the asset, at least initially. The more touches on support, the weaker it gets and the more likely it is to fail to hold the price.
Resistance or resistance level: Opposite of support. The level that is likely to reject the price, at least initially. The more touches at resistance, the weaker it gets and the more likely it is to fail to hold back the price.
SMA: Simple Moving Average. Average price based on closing prices over the specified period. In the case of RSI, it is the average strength index value over the specified period.
Fibonacci Retracements and Extensions: Ratios based on what is known as the golden ratio, a universal ratio pertaining to growth and decay cycles in nature. The golden ratio is based on the constants Phi (1.618) and phi (0.618).
Oscillators: Technical indicators that vary over time, but typically remain within a band between set levels. Thus, they oscillate between a low level (typically representing oversold conditions) and a high level (typically representing overbought conditions). E.G., Relative Strength Index (RSI) and Moving Average Convergence-Divergence (MACD).
RSI Oscillator: TheRelative Strength Index is a momentum oscillator that moves between 0 and 100. It measures the speed of the price and changes in the speed of the price movements. When RSI is over 70, it is considered to be overbought. When RSI is below 30, it is considered to be oversold.
MACD Oscillator: Moving Average Convergence-Divergence is a momentum oscillator that subtracts the difference between 2 moving averages to indicate trend as well as momentum.
This post Bitcoin Bulls Eye $94K Breakout Ahead of Crucial FOMC Rate Cut Decision first appeared on Bitcoin Magazine and is written by Ethan Greene - Feral Analysis and Juan Galt.
Disclaimer: The content of this article solely reflects the author's opinion and does not represent the platform in any capacity. This article is not intended to serve as a reference for making investment decisions.
You may also like
Crypto Market Faces New Frontier of Abuse, Solidus Labs Warns
Solana's Latest Steep Drop: An In-Depth Analysis of Security Flaws and Governance Challenges Facing Fast Smart Contract Networks
- Solana's SOL token plummeted below $165 in late 2025 amid heightened bearish sentiment and systemic risks. - Network vulnerabilities including a $36M Upbit hack, 68% validator node decline, and cryptographic flaws eroded investor confidence. - Governance dysfunction marked by stalled DAOs, delayed security patches, and inactive protocols (75% of 264) hindered crisis response. - Market fundamentals weakened with 20% TVL drop, 16% fee decline, and ETF outflows despite temporary DEX volume spikes. - Institu

Short the dip and buy the rip? What FOMC outcomes reveal about Bitcoin price action

Bitcoin Leverage Liquidation: Does It Pose a Systemic Threat to Retail Crypto Investors?
- October 2025's Bitcoin crash triggered $19B in leveraged liquidations, exposing crypto derivatives' fragility amid extreme retail leverage and thin liquidity. - High leverage (up to 1,001:1) and perpetual futures dominated by platforms like Hyperliquid amplified volatility, creating self-reinforcing downward spirals. - Behavioral biases (FOMO, overconfidence) and social media echo chambers drove irrational leveraged bets, while regulators paused risky ETFs and warned of systemic risks. - The crisis highl