Bitget App
Trade smarter
Buy cryptoMarketsTradeFuturesEarnSquareMore
Ethereum (ETH) To Rise Further? This Key Pattern Formation Suggest So!

Ethereum (ETH) To Rise Further? This Key Pattern Formation Suggest So!

CoinsProbeCoinsProbe2025/12/04 18:12
By:Nilesh Hembade

Date: Thu, Dec 04, 2025 | 04:10 AM GMT

The broader cryptocurrency market is showing notable upside momentum as Ethereum (ETH) surges over 5% in the last twenty-four hours. More importantly, ETH’s 4-hour chart is flashing a well-defined harmonic structure — a formation that often signals strong trend continuation before a potential reversal. And this time, the setup points to further upside in the short term.

Ethereum (ETH) To Rise Further? This Key Pattern Formation Suggest So! image 0 
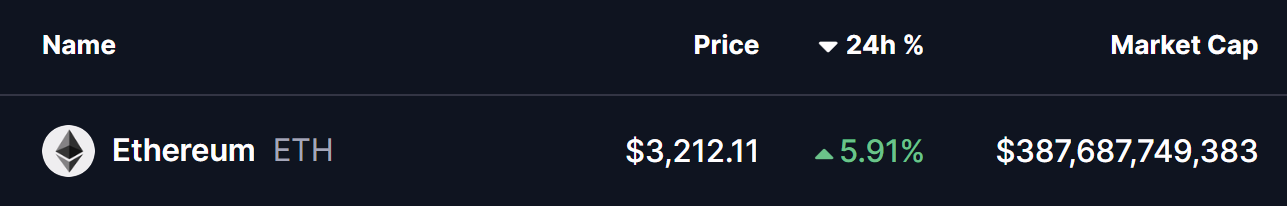
Source: Coinmarketcap

Harmonic Pattern Hints at Potential Upside

On the 4H timeframe, ETH has shaped a clean Bearish Bat harmonic pattern. Despite the name, this pattern typically includes a strong bullish rally during the CD leg as the price travels toward the Potential Reversal Zone (PRZ).

The structure initiated from Point X near the $3,657 level before dropping sharply into Point A. ETH then bounced into Point B and retraced again toward Point C around $2,716 — a zone that triggered a strong reaction from buyers. From that point, ETH began accelerating upward, reclaiming the 100-hour moving average at $3,048, highlighting renewed control from bulls and a shift in short-term market sentiment.

Ethereum (ETH) To Rise Further? This Key Pattern Formation Suggest So! image 1 
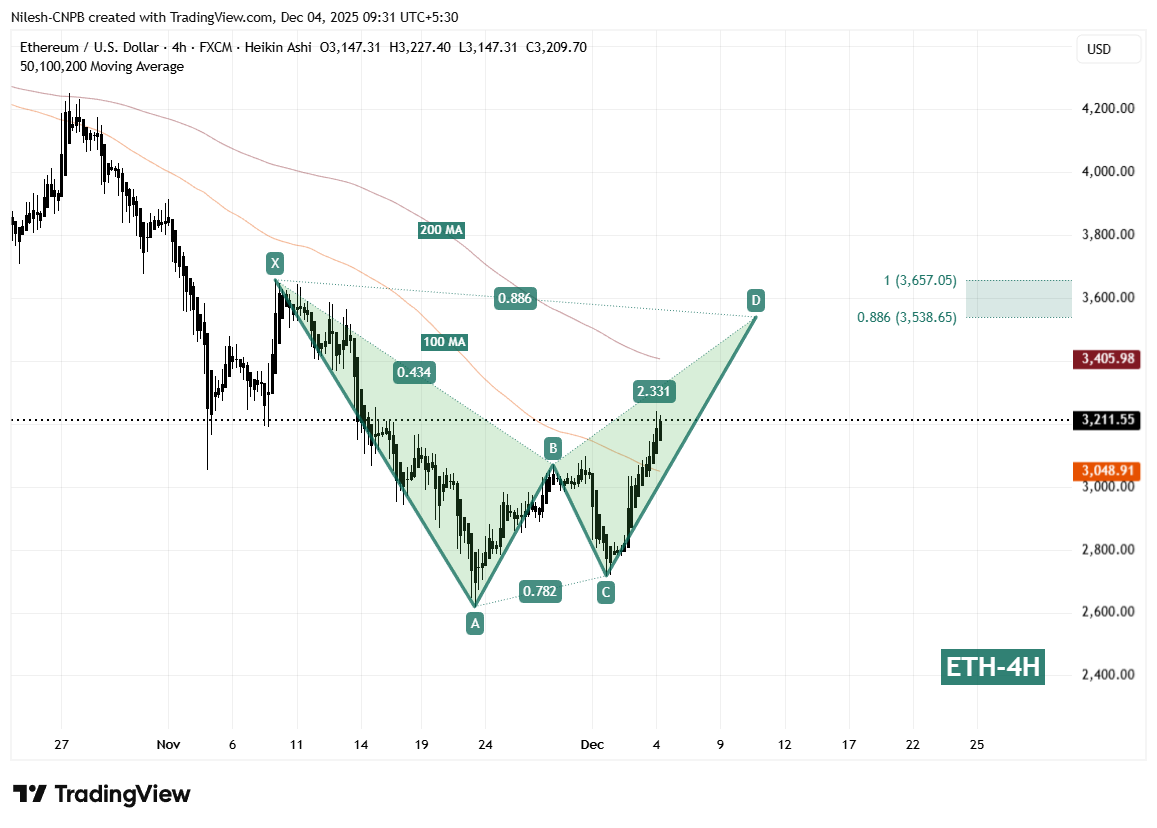
Ethereum (ETH) 4H Chart/Coinsprobe (Source: Tradingview)

At present, ETH is trading around $3,211 and is inching closer to its next critical barrier — the 200-hour moving average at $3,405. This level now acts as the gateway for a potential extension of the bullish move.

What’s Next for ETH?

If ETH maintains its strength above the 100 MA and successfully breaks through the 200 MA, the chart suggests a continuation toward the harmonic PRZ. This target zone sits between $3,538.65 (0.886 Fibonacci) and $3,657.05 (the full extension), marking the potential completion area of the Bearish Bat pattern. Historically, this region acts as a significant decision point where price may face heavier resistance.

However, if ETH loses the 100-hour MA or shows hesitation before reaching the 200 MA, the market could slip into a minor pullback or sideways phase. Such a move would likely give bulls time to build renewed momentum before attempting another breakout.

For now, ETH’s market structure is improving rapidly. Higher lows, reclaiming moving averages, and a clearly progressing harmonic pattern all point to the possibility of additional upside in the near term.

0
0

Disclaimer: The content of this article solely reflects the author's opinion and does not represent the platform in any capacity. This article is not intended to serve as a reference for making investment decisions.

PoolX: Earn new token airdrops
Lock your assets and earn 10%+ APR
Lock now!

You may also like

PENGU USDT Sell Alert and Stablecoin Price Fluctuations: Evaluating Algorithmic Dangers Amid Changing Cryptocurrency Markets

- PENGU USDT's 2025 volatility reignited debates on algorithmic stablecoin fragility amid regulatory uncertainty and post-UST market skepticism. - Technical analysis showed conflicting signals: overbought MFI vs bearish RSI divergence, with critical support/resistance levels at $0.010-$0.013. - $66.6M team wallet outflows and 32% open interest growth highlighted liquidity risks, while UST's collapse legacy exposed algorithmic design flaws. - Investors increasingly favor fiat-backed alternatives like USDC ,

Bitget-RWA2025/12/10 07:42
PENGU USDT Sell Alert and Stablecoin Price Fluctuations: Evaluating Algorithmic Dangers Amid Changing Cryptocurrency Markets

HYPE Token Experiences Rapid Growth in December 2025: Evaluating Authenticity and Investment Opportunities Amidst an Unstable Post-ETF Cryptocurrency Landscape

- HYPE token surged in Dec 2025 amid post-Bitcoin ETF crypto optimism , raising questions about its investment legitimacy. - Hyperliquid's 72.7% decentralized trading volume share and $106M monthly revenue highlight its DeFi infrastructure strength. - Institutional backing from Paradigm and a $1B DAT fund signals confidence, though major exchange listings remain pending. - Price volatility, token unlocks, and mixed expert opinions underscore risks, with potential $53–$71 targets contingent on market condit

Bitget-RWA2025/12/10 07:10

LUNA Falls by 5.77% Over 24 Hours Despite Fluctuating Medium-Term Performance

- LUNA fell 5.77% in 24 hours to $0.1512, but rose 47.52% in 7 days and 105.96% in 30 days. - However, it still faces a 64.14% annual loss, highlighting crypto market volatility and long-term risks for investors. - The price swing reflects sensitivity to macroeconomic shifts and sentiment, with analysts noting ongoing uncertainty in forecasts. - Investors are weighing recent resilience against regulatory challenges and institutional behavior shifts, monitoring if the drop signals a bearish trend or tempora

Bitget-RWA2025/12/10 06:48
LUNA Falls by 5.77% Over 24 Hours Despite Fluctuating Medium-Term Performance

The Downfall of ChainOpera AI Token: An Alert for AI-Based Cryptocurrency Investments

- ChainOpera AI (COAI) token's 96% collapse in late 2025 highlights systemic risks in AI-driven crypto assets, prompting reevaluation of governance and regulatory frameworks. - Centralized ownership (88% by top 10 holders) and governance flaws at C3.ai exacerbated volatility, undermining decentralization and investor trust. - The crisis triggered sector-wide sell-offs, shifting capital to meme coins, while 2025 regulatory penalties rose 417% to $1.23B, intensifying scrutiny. - Experts warn speculative AI-c

Bitget-RWA2025/12/10 06:40
The Downfall of ChainOpera AI Token: An Alert for AI-Based Cryptocurrency Investments
© 2025 Bitget