
HBAR Price Near a Range Break — And the Next Move Could Hurt Bulls

HBAR is down almost 31% over the past month, even after posting a sharp 27% rebound between November 21 and 23. That bounce still keeps about 11% of gains on the weekly chart, but the move has stalled again. The token has spent almost a full week trading between two close price levels, and that
HBAR is down almost 31% over the past month, even after posting a sharp 27% rebound between November 21 and 23. That bounce still keeps about 11% of gains on the weekly chart, but the move has stalled again.
The token has spent almost a full week trading between two close price levels, and that tight range now looks ready to break. Key signs are now flashing. However, the signals suggest that the break might not favor the bulls.
Momentum Signals Turn Against Hedera
HBAR’s momentum weakened right after the rebound. Between November 23 and November 26, the price formed a lower high while the RSI made a higher high.
The RSI, or Relative Strength Index, measures momentum. When momentum rises, but the chart prints a lower high, it creates a hidden bearish divergence, which often signals that the downtrend can continue.
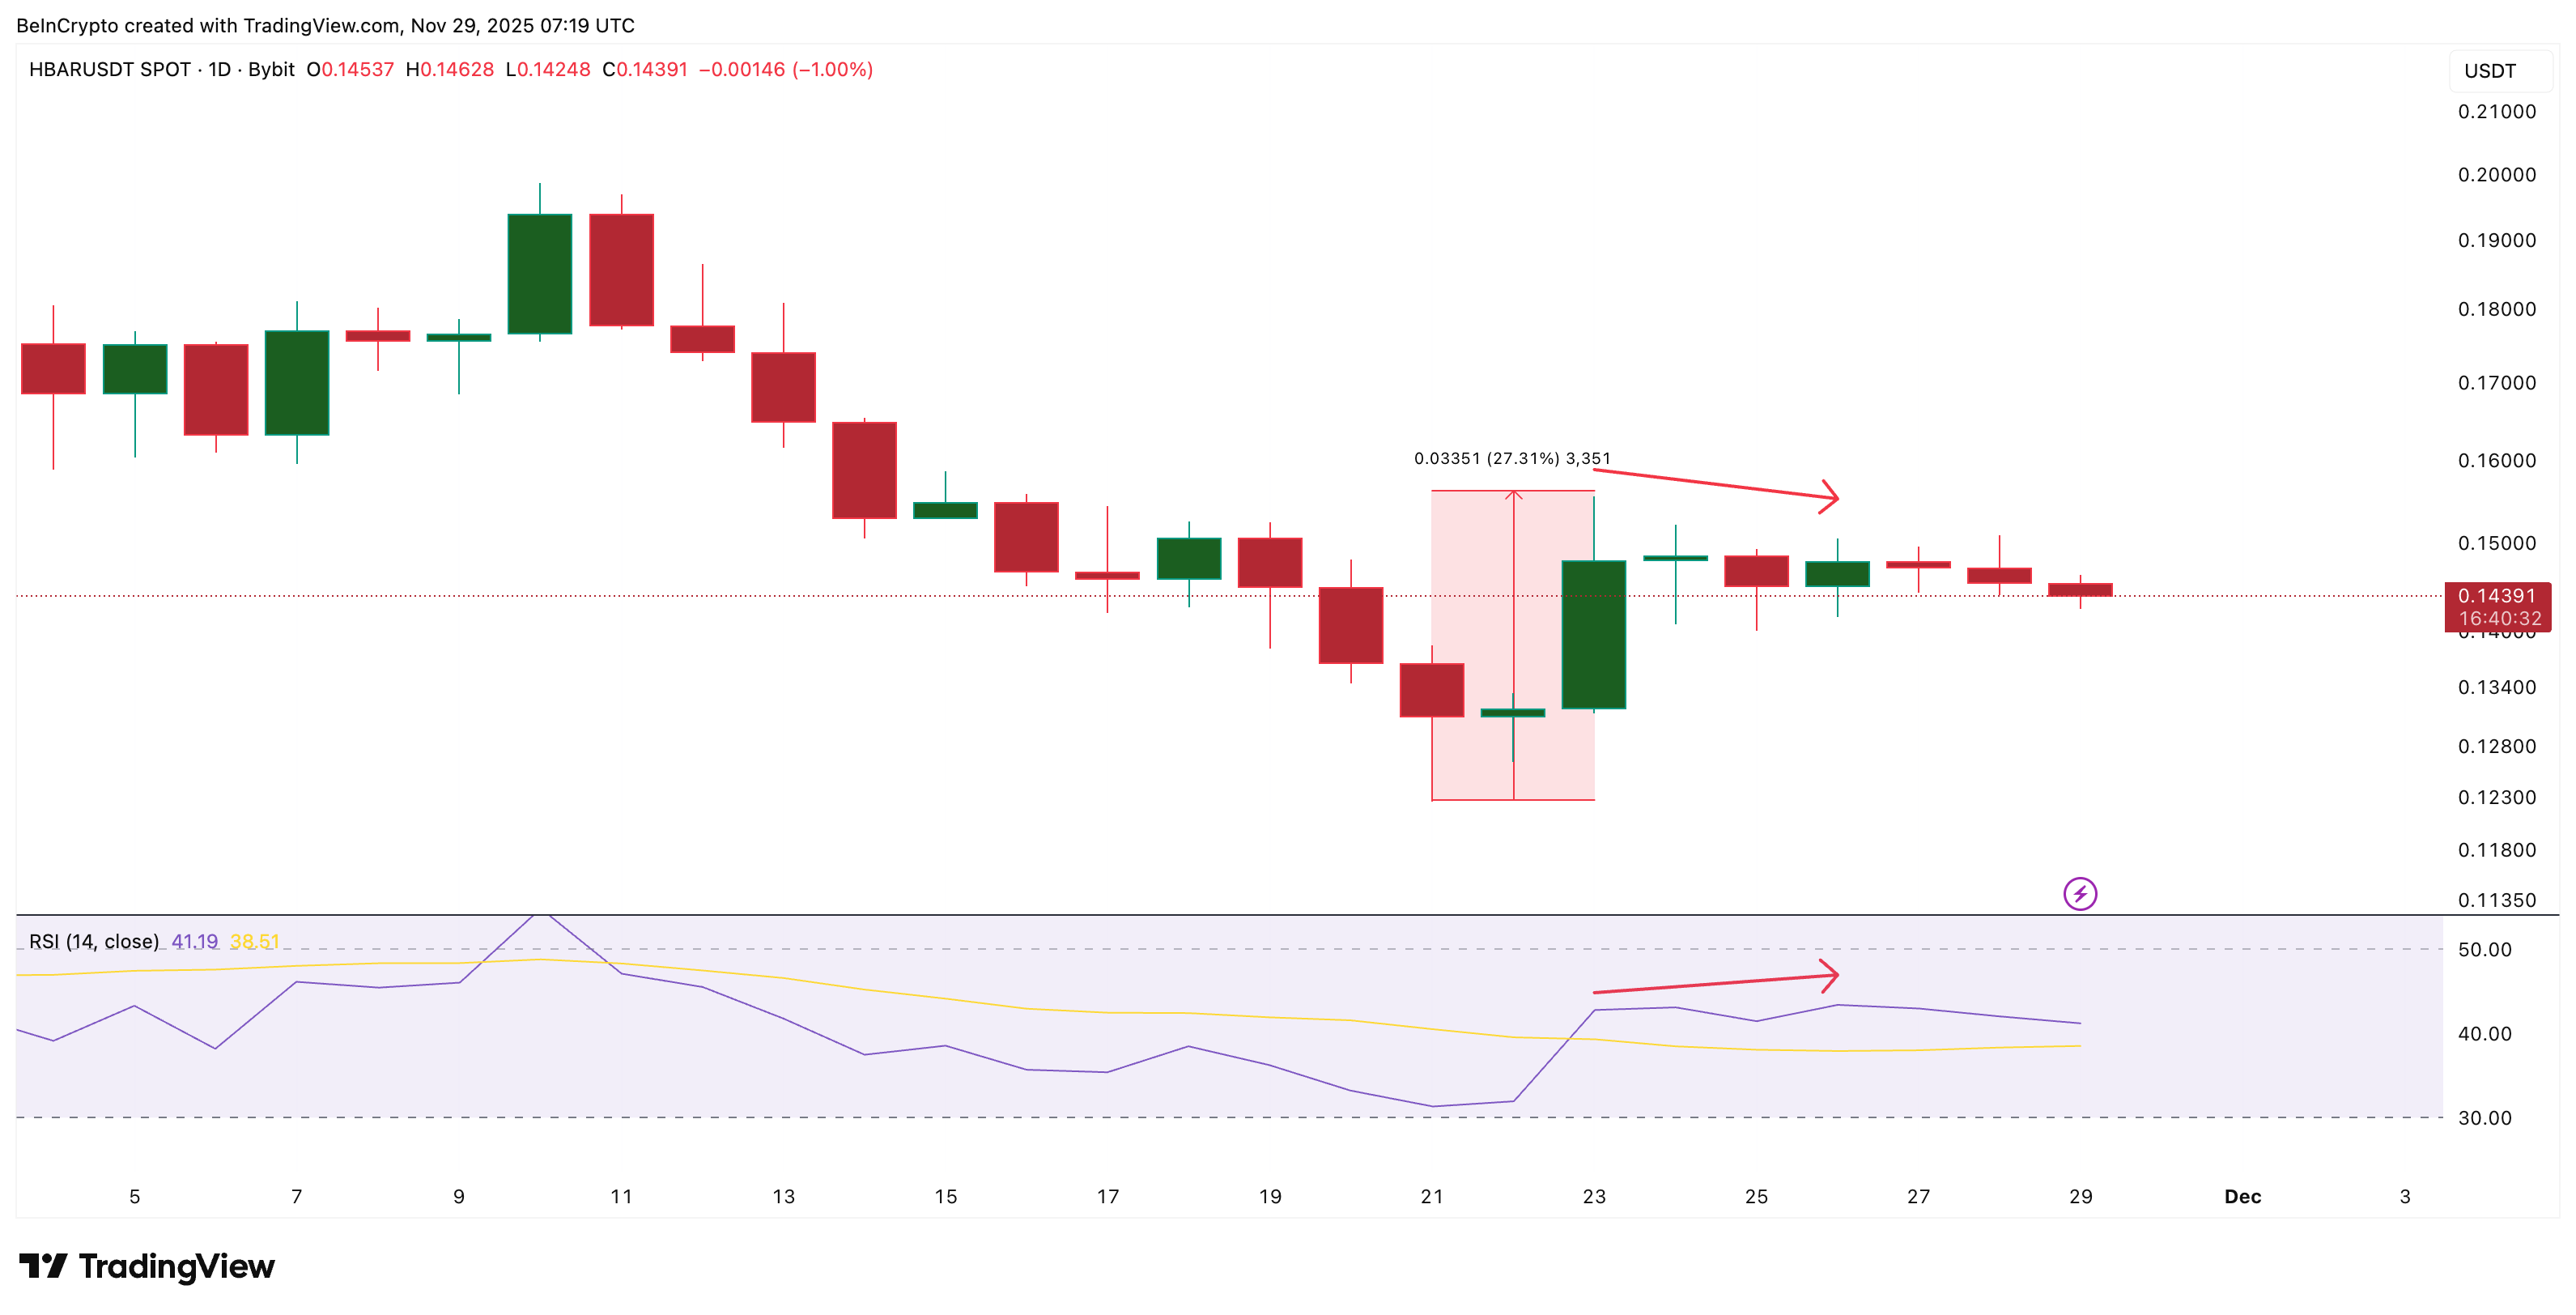 HBAR Faces A Bearish Risk:
TradingView
HBAR Faces A Bearish Risk:
TradingView
Want more token insights like this? Sign up for Editor Harsh Notariya’s Daily Crypto Newsletter here.
HBAR’s broader trend still shows a 31% drop over the past month, so the setup fits the pattern.
Volume data points the same way. OBV, or On-Balance Volume, tracks whether real buyers or sellers dominate.
HBAR’s OBV remains stuck under a descending trendline, and between November 25 and 28, the price made a higher low, but OBV made a lower low.
This is a bearish divergence, indicating fading buyer strength, even as the candles attempt to stabilize. As long as OBV trades under the trendline, pressure stays on the downside.
 Volume Weakens:
TradingView
Volume Weakens:
TradingView
Both divergences reinforce each other. They explain why the rebound from November 21 to 23 could not build follow-through and why the current range looks unstable.
With momentum fading and buyer pressure weakening at the same time, the market may try to extend the previous downtrend.
HBAR Price Levels: One Range, Two Outcomes
The HBAR price has been moving between $0.151 on the upside and $0.140 on the downside for almost a week. That’s the same tight range mentioned earlier.
Momentum signals now show that this range is close to breaking.
If $0.140 gives way, the chart opens a move toward $0.122, which is the most recent support zone. A clean candle close below $0.140 confirms the breakdown and wipes out what remains of the weekly rebound.
For the bearish setup to fail, the entire structure must shift. OBV needs to break above its descending trendline so that buyer pressure returns.
At the same time, HBAR must close above $0.151, a level it has not crossed since November 16.
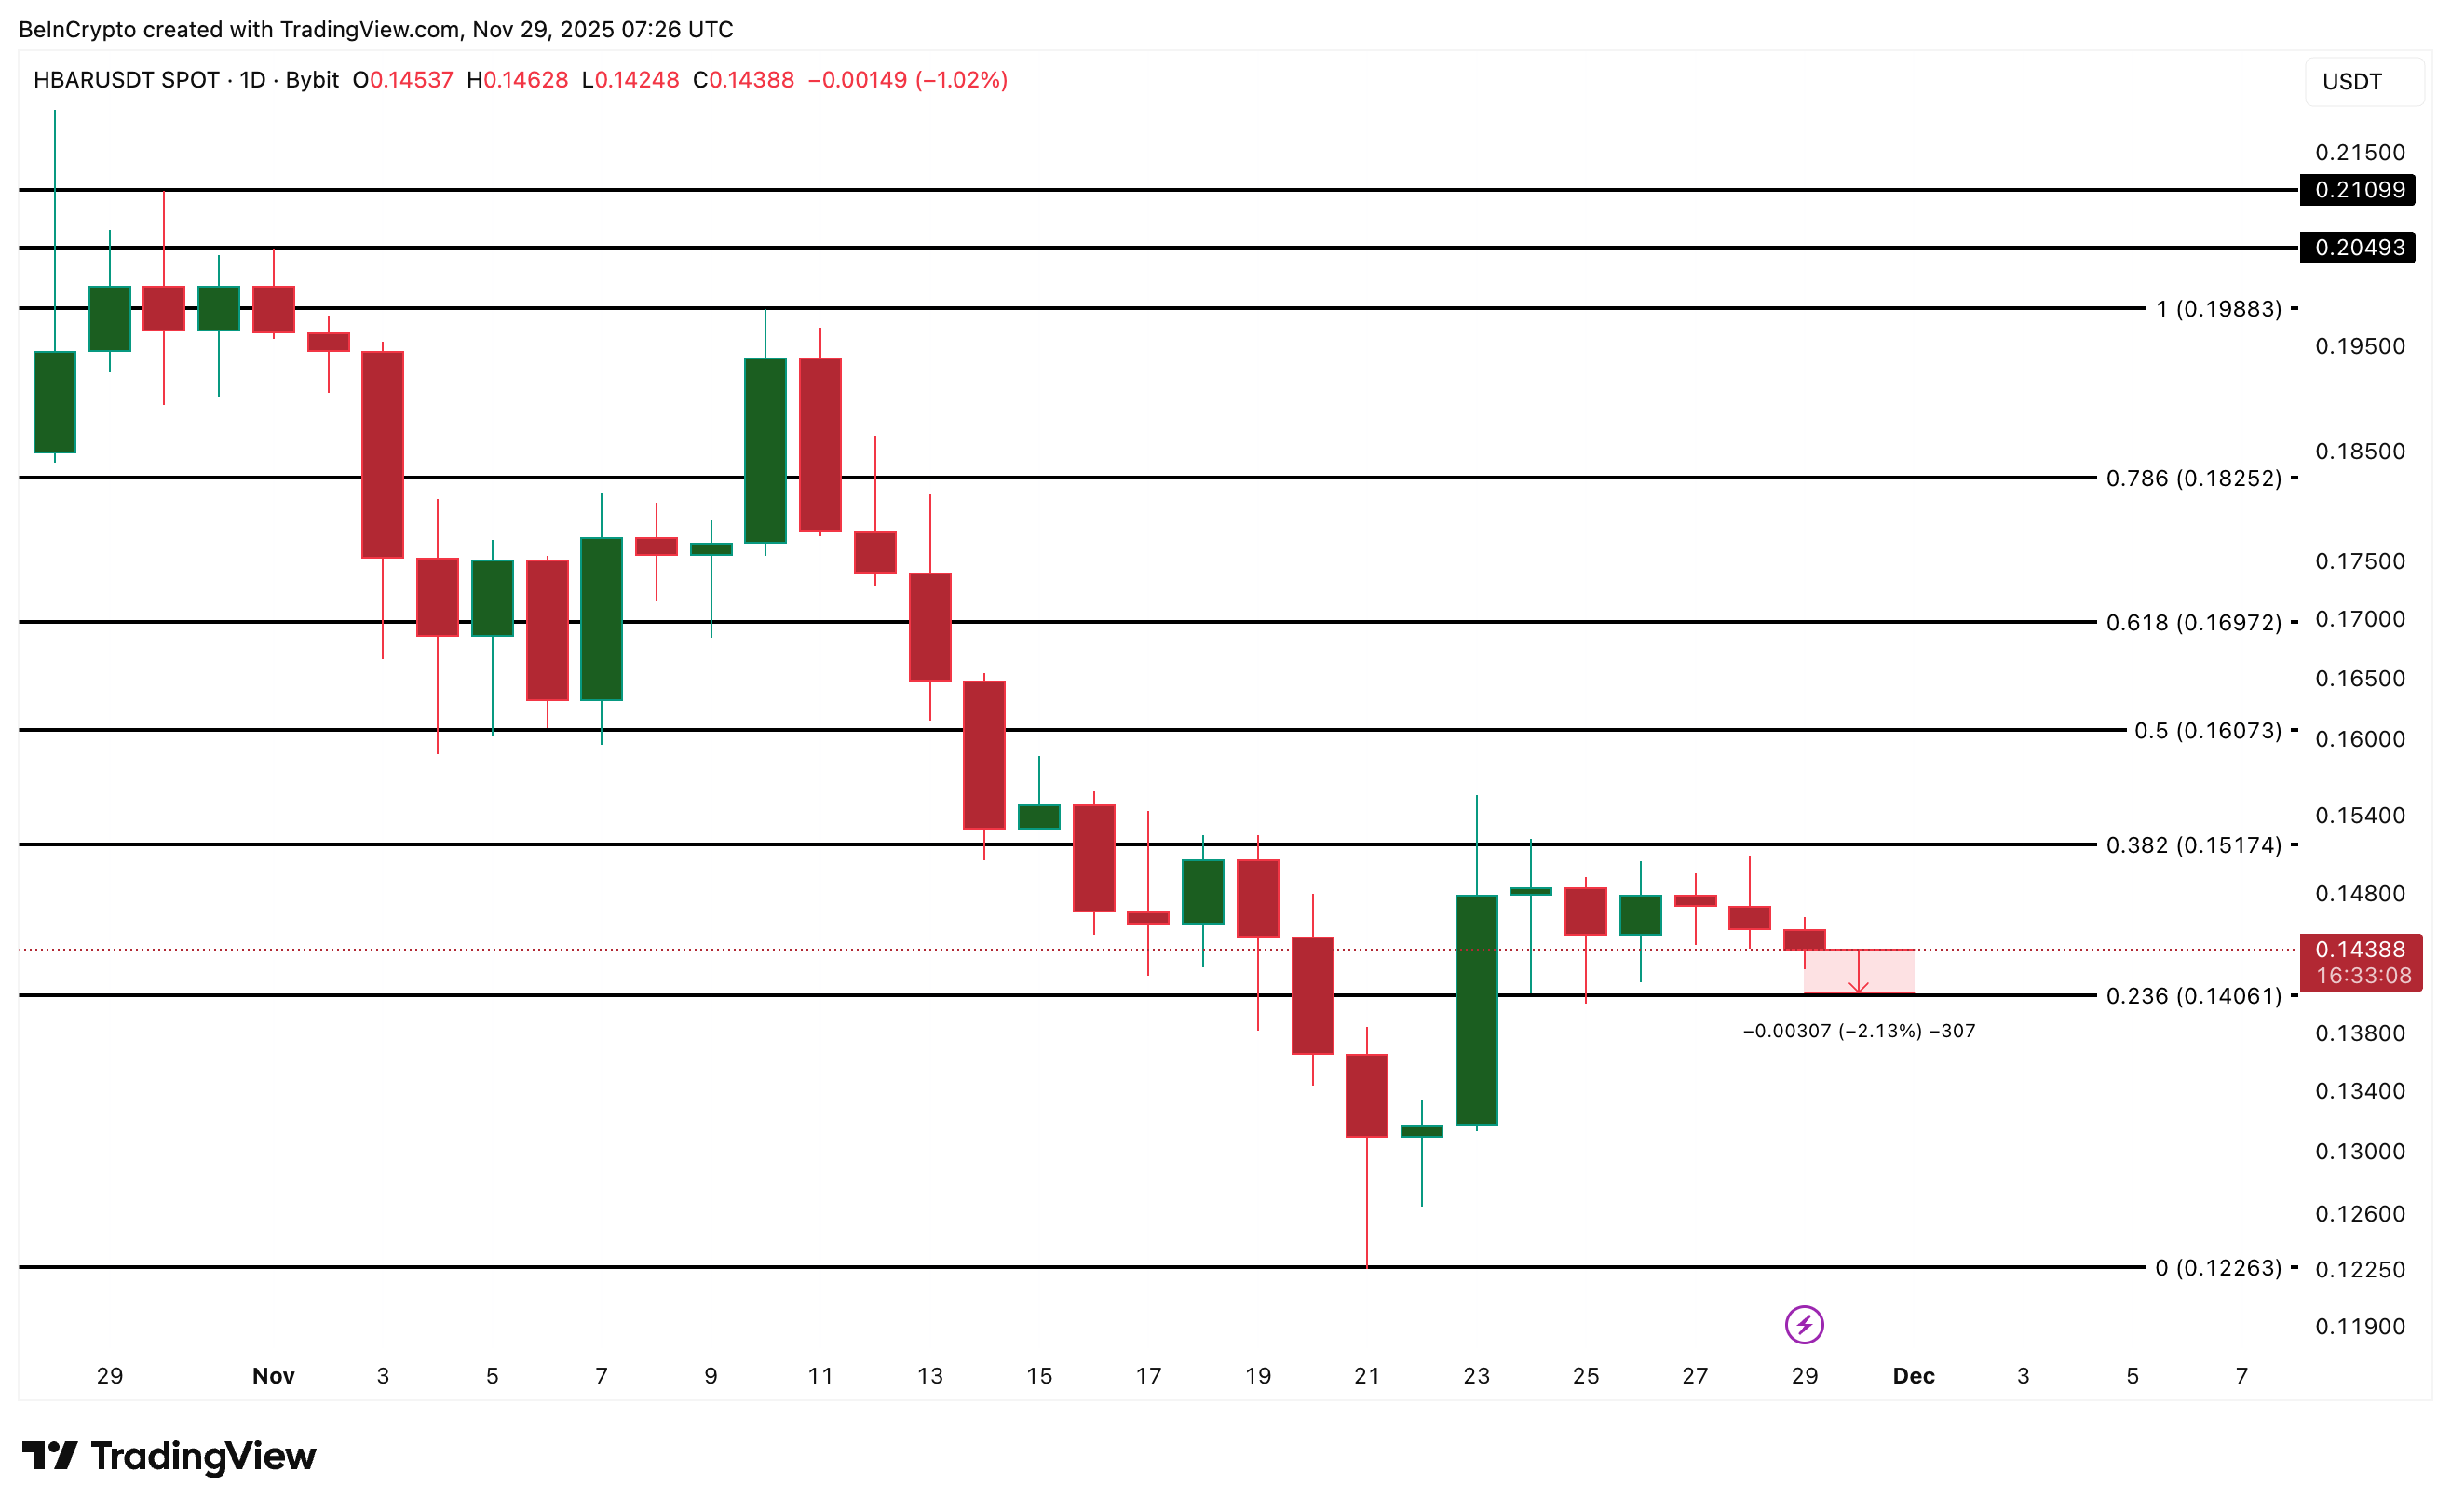 ‘HBAR Price Analysis:
TradingView
‘HBAR Price Analysis:
TradingView
Until those conditions are met, the HBAR price remains at risk. The range may not hold if the broader market weakens again, and the next move could come quickly once the $0.140 line breaks or holds.
Read the article at BeInCryptoDisclaimer: The content of this article solely reflects the author's opinion and does not represent the platform in any capacity. This article is not intended to serve as a reference for making investment decisions.
You may also like
The HYPE Token Crypto Rally: Unveiling the Driving Force Behind Its Week-Long Surge
- HYPE Token's 7-day surge in late 2025, reaching $35.08, was driven by protocol upgrades, institutional backing, and retail FOMO. - Institutional investments like Paradigm’s $581M stake and retail-driven momentum mirrored the 2021 Dogecoin rally. - However, looming token unlocks and bearish indicators, including a $11B unlock of 237M tokens, raised sustainability concerns. - Technical analysis showed mixed signals, with consolidation near support levels and short-term volatility risks, while broader trend

How CFTC-Recognized Platforms Such as CleanTrade Are Transforming the Landscape of Clean Energy Investments
- CFTC-approved CleanTrade introduces a regulated SEF for clean energy derivatives, addressing market fragmentation and liquidity gaps. - The platform enables institutional-scale trading of vPPAs/RECs, achieving $16B notional volume in two months by aggregating demand/supply. - Integrated risk analytics (e.g., CleanSight) enhance transparency, allowing investors to hedge project-specific risks like grid congestion and curtailment. - Dual investment pathways attract hedge funds/pension funds through direct

The Rise of CFTC-Regulated Clean Energy Markets: Opening a New Chapter for Institutional Investors
- CFTC's 2025 approval of REsurety's CleanTrade as a SEF marks a landmark shift in clean energy markets by introducing standardized, transparent trading for VPPAs and RECs. - The platform attracted $16B in notional value within two months, enabling rapid institutional-grade transactions that previously took months to negotiate. - By addressing liquidity gaps and enabling precise risk modeling, CleanTrade is accelerating capital flows into decarbonization while bridging ESG investment gaps for institutional

The Increasing Overlap Between Health and Financial Wellbeing in Managing Personal Finances
- Global wellness economy to hit $9 trillion by 2028, driven by holistic well-being trends. - Millennials/Gen Z prioritize wellness as lifestyle, with 55% spending over $100/month on health. - Employers integrate financial wellness into health programs to reduce burnout and boost productivity. - Investors target wellness-driven SaaS, healthcare tech , and financial literacy platforms for holistic solutions.
