Did The 22% Merlin Chain (MERL) Price Rally Just Confirm A Bull Trap?

Merlin Chain (MERL) is a Bitcoin Layer-2 project designed to enable faster, cheaper transactions on the Bitcoin network. The token is up about 22.5% in the past 24 hours and trades near $0.31. Over three months, the Merlin Chain price is still up about 171%. But the past month tells a different story. In that
Merlin Chain (MERL) is a Bitcoin Layer-2 project designed to enable faster, cheaper transactions on the Bitcoin network. The token is up about 22.5% in the past 24 hours and trades near $0.31. Over three months, the Merlin Chain price is still up about 171%. But the past month tells a different story. In that window, MERL is down about 15%, even after the latest spike.
So the question is simple. Did this sharp move up strengthen the trend, or was it more of an outlier? The charts suggest that the 24-hour window rally only strengthened its trend reversal theory. And not in a good way!
Rally Looks Strong, But The Underlying Signals Do Not
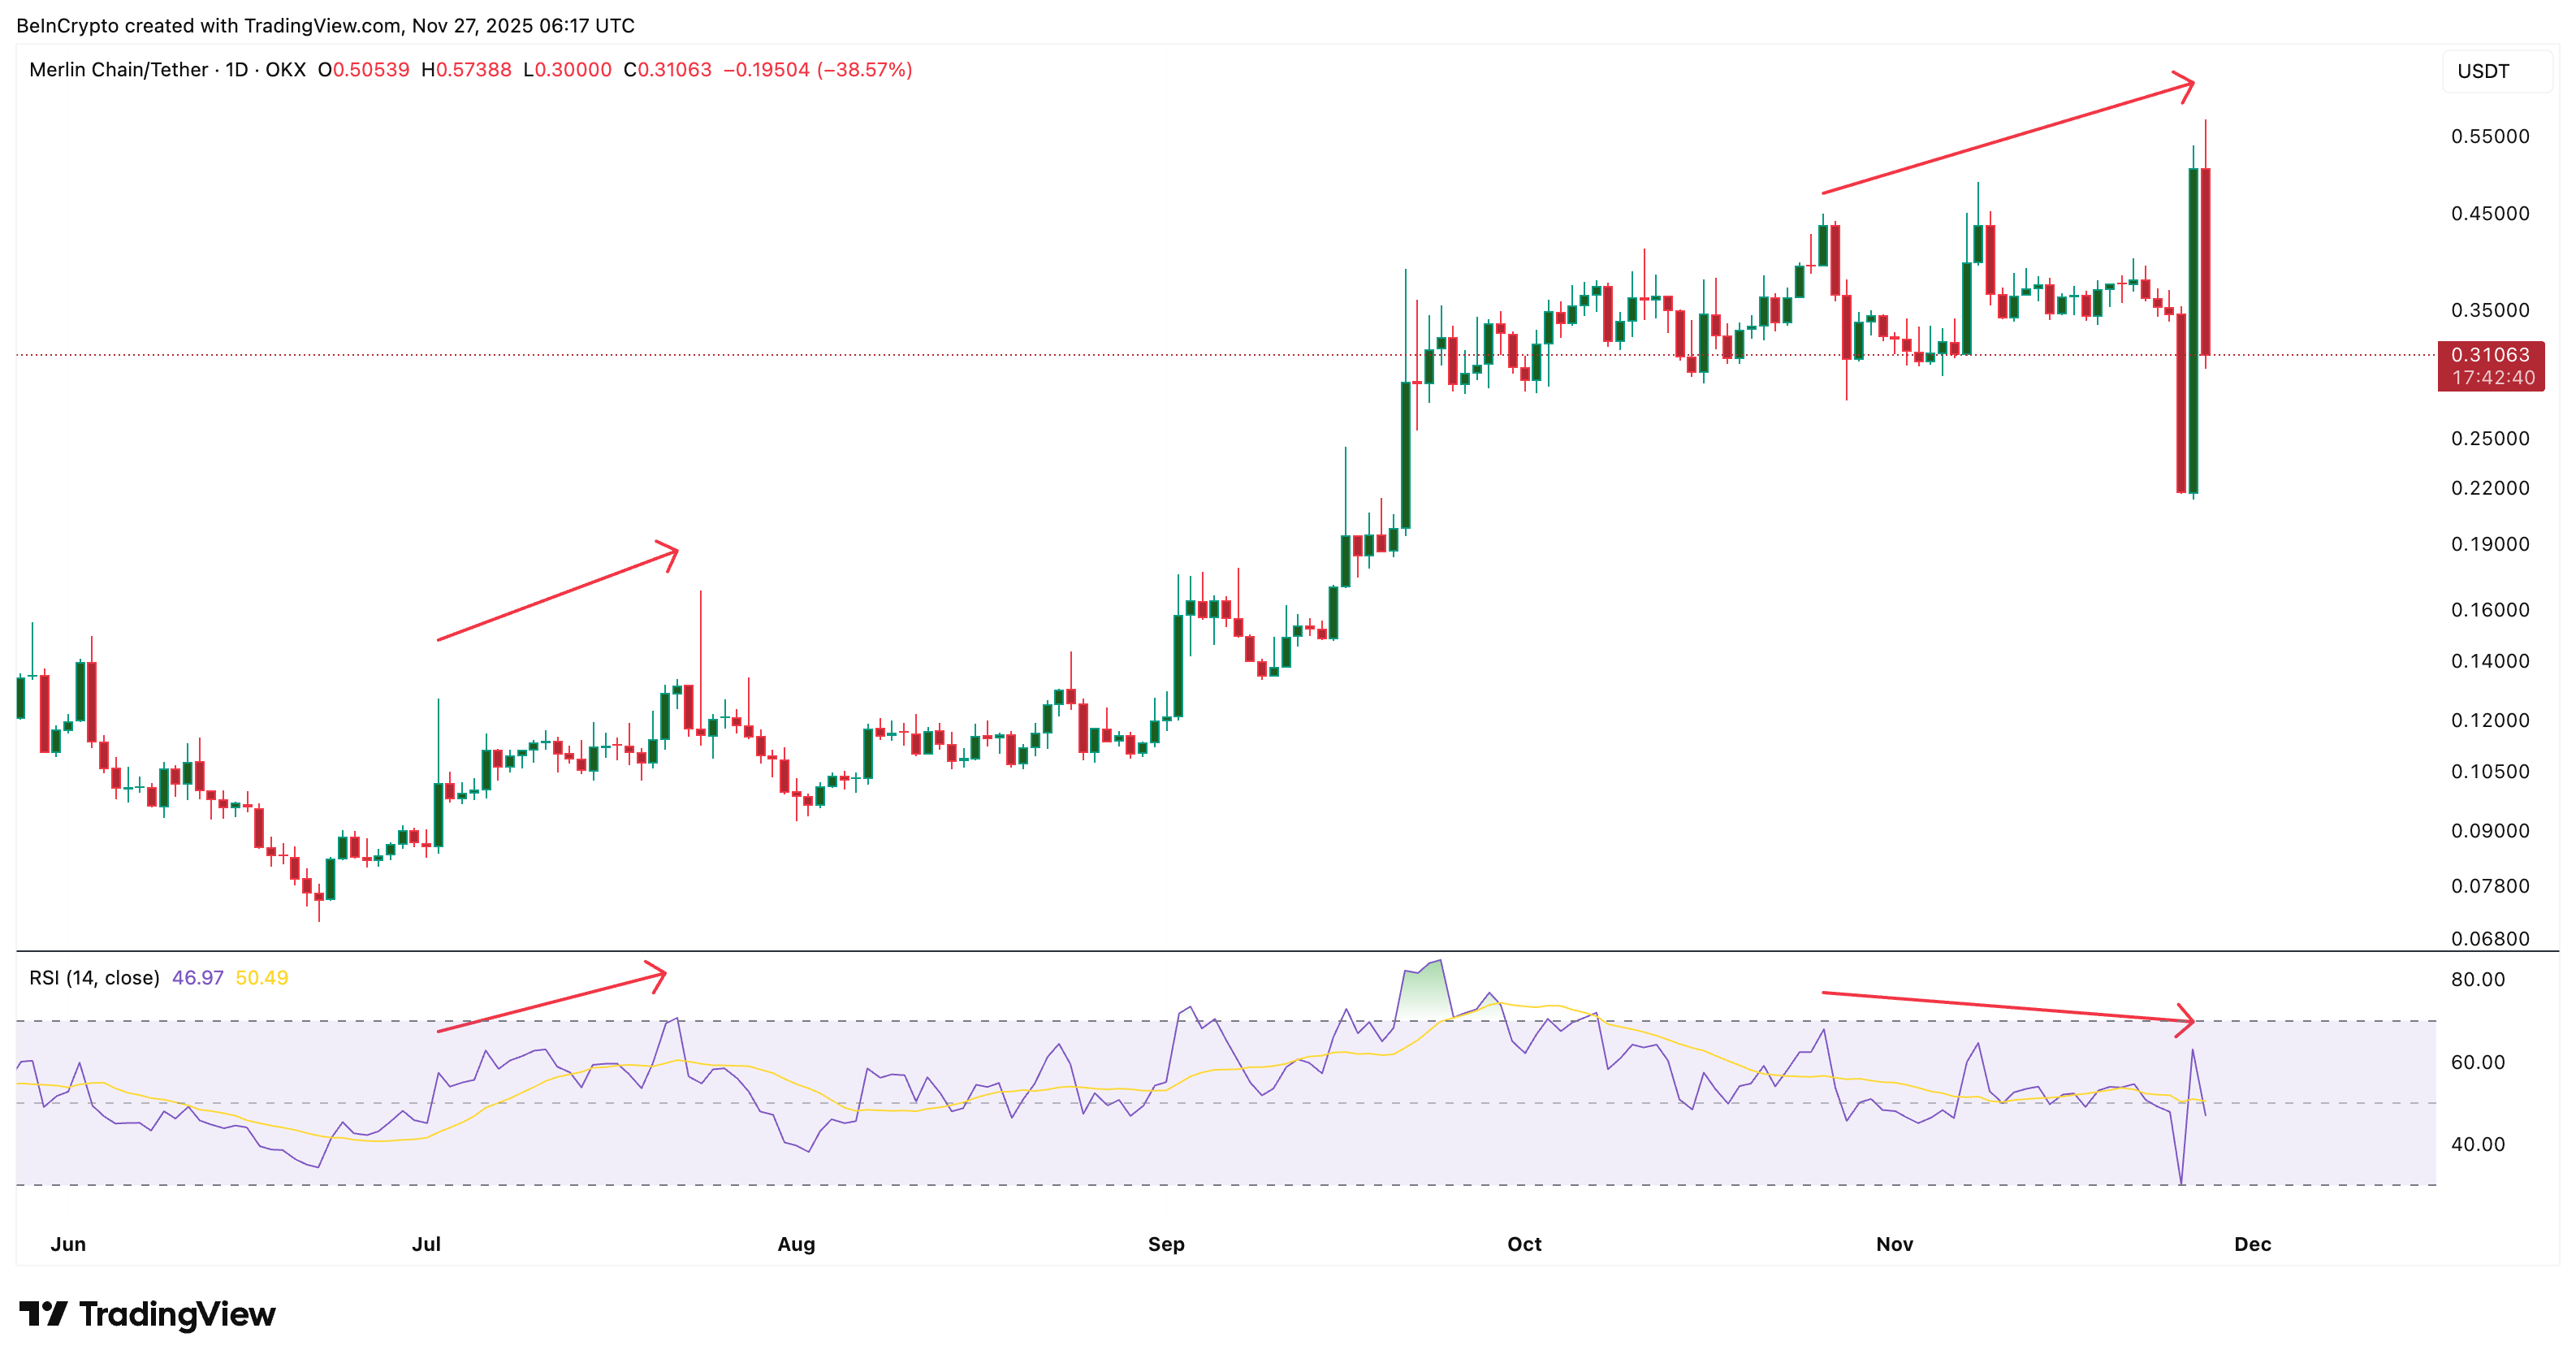
Earlier in Merlin Chain’s long uptrend, starting around late June, the price and the Relative Strength Index (RSI) moved together. RSI measures buying and selling strength, and both the price highs and RSI highs kept rising. That is how a healthy rally behaves.
The past month breaks that pattern. Between October 26 and November 26, the Merlin Chain price made a higher high. RSI produced a lower high. That is standard bearish divergence. It often appears near the end of an uptrend, signaling that the next leg may turn down.
 MERL Trend Reversal Coming:
TradingView
MERL Trend Reversal Coming:
TradingView
Want more token insights like this? Sign up for Editor Harsh Notariya’s Daily Crypto Newsletter here.
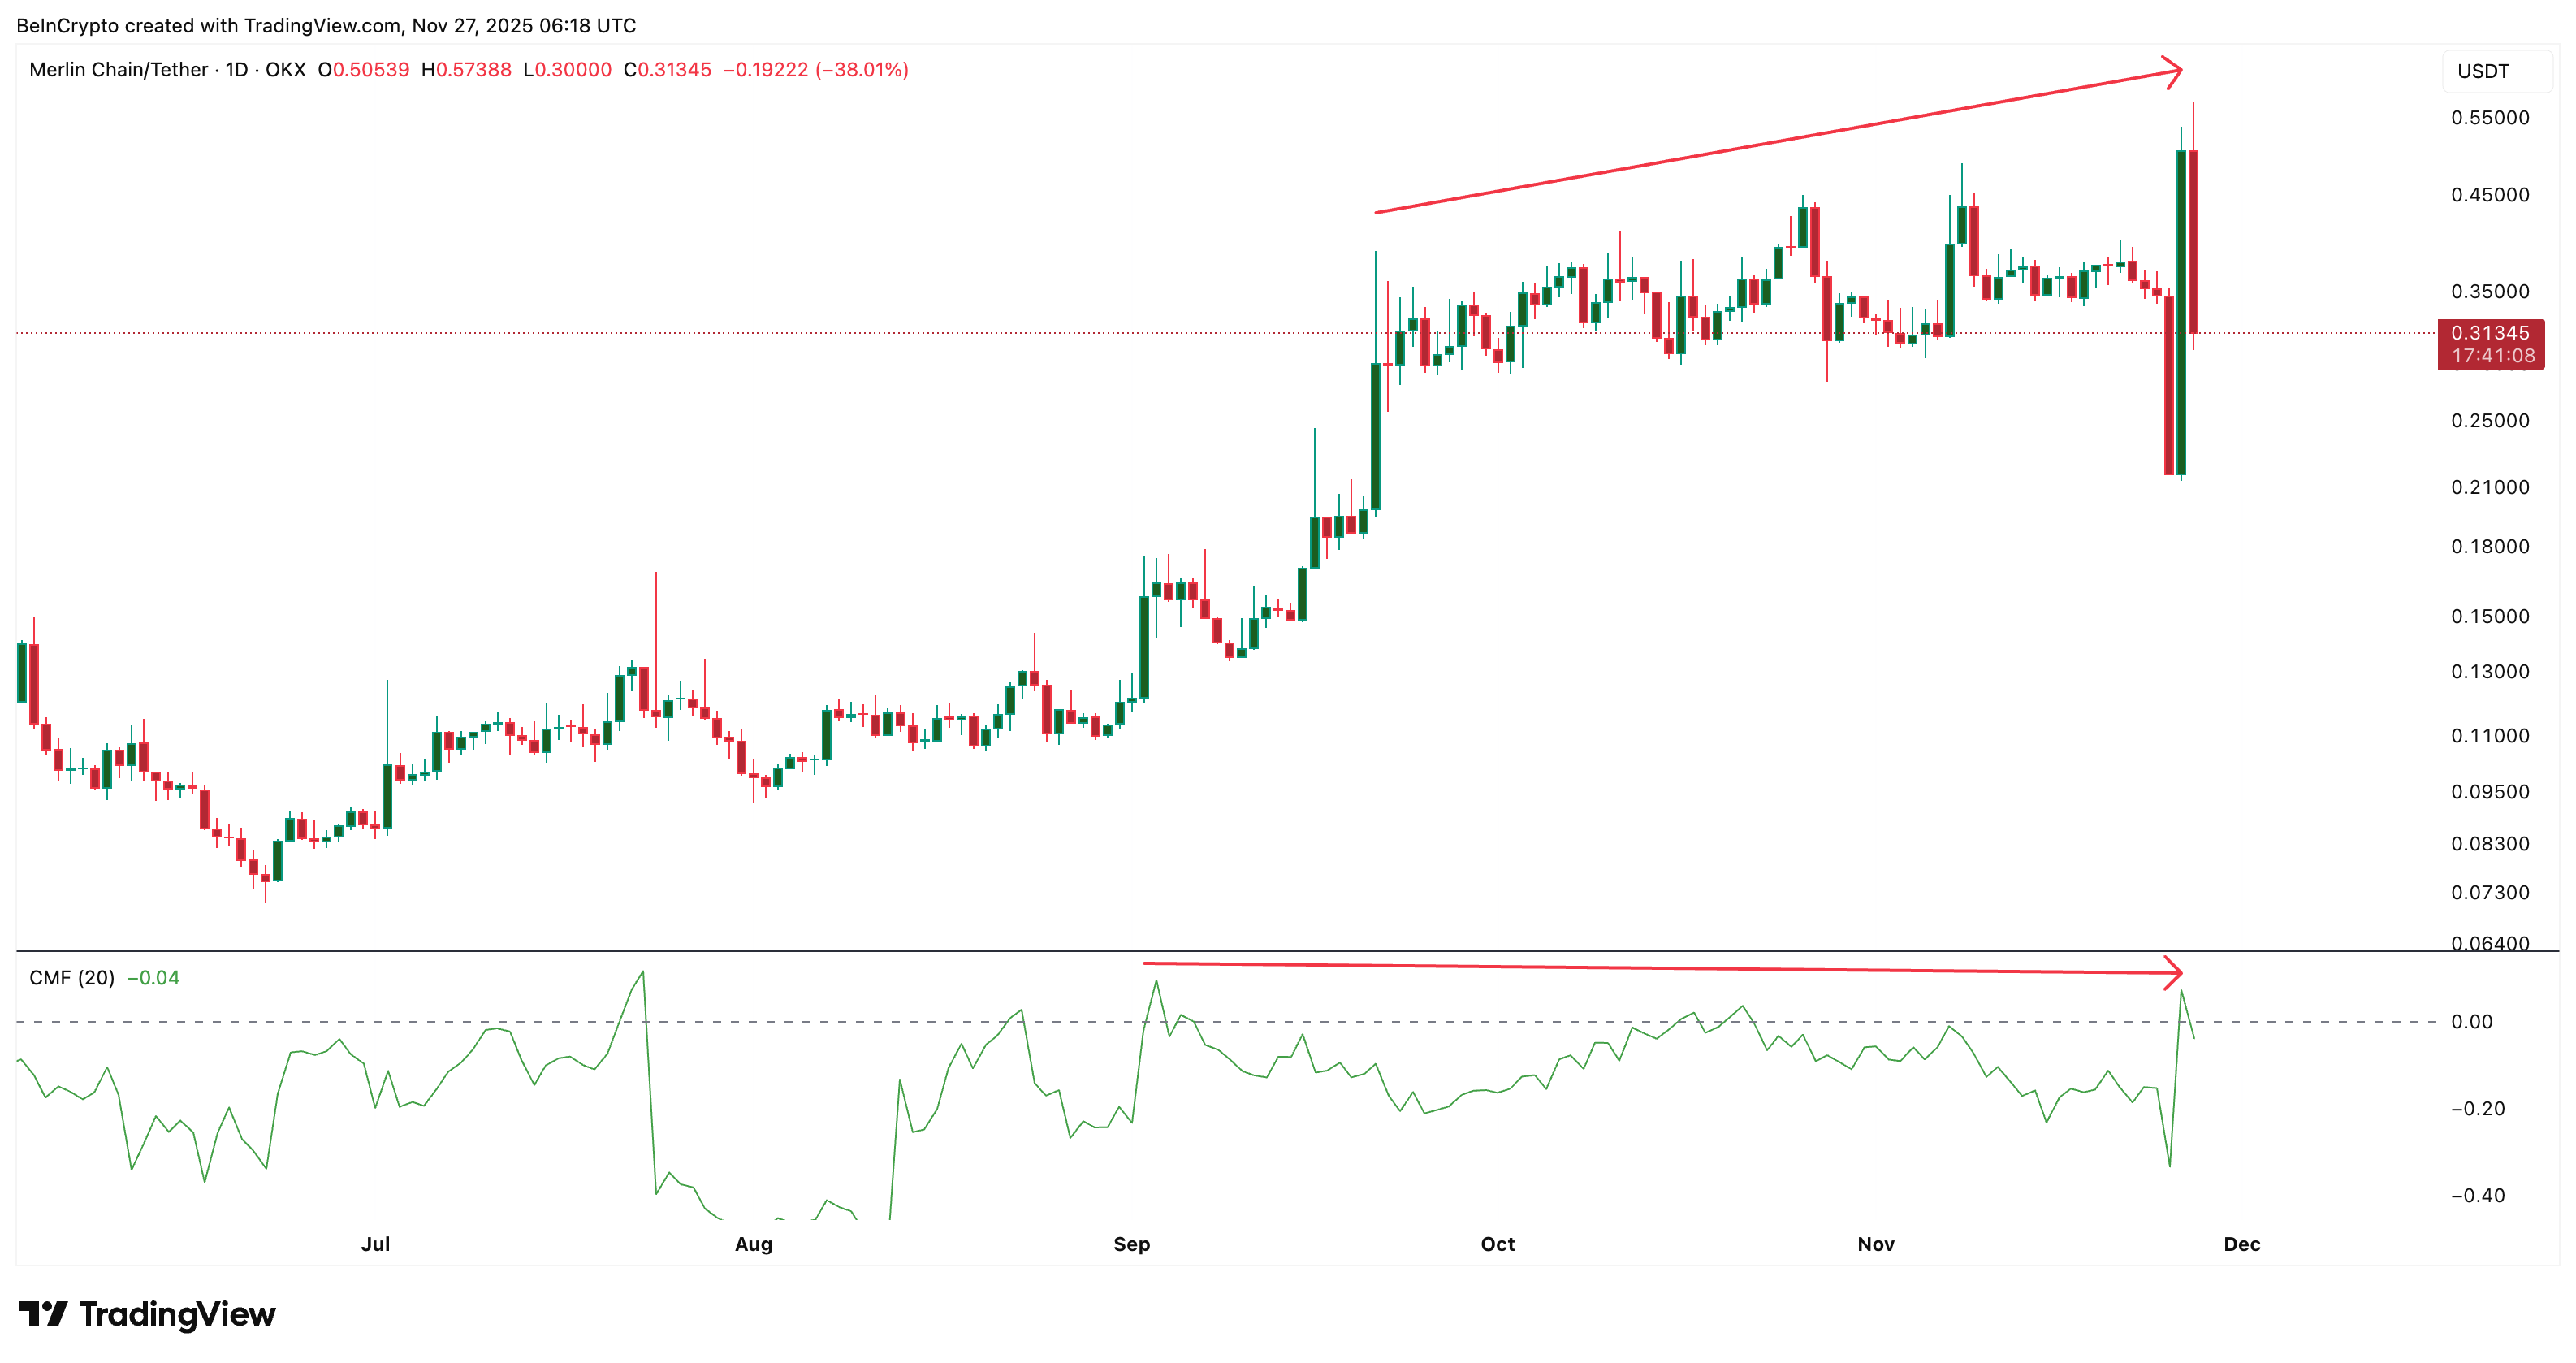
Chaikin Money Flow (CMF), which tracks whether big buyers are supporting the move, adds more pressure.
From September 21 to November 26, the MERL price made higher highs again. CMF made lower highs and has now fallen under the zero line. A drop under zero, while forming bearish divergence against the price, means large-money inflows have weakened even while the chart pushed to new highs.
 Big Money Slows Down:
TradingView
Big Money Slows Down:
TradingView
The 22% spike did not fix this. In fact, the candle right after the jump turned red, showing that sellers used the strength to exit instead of joining. When both RSI and CMF weaken while price hits new highs, the setup often hints at a bull trap — a fast move up that lures buyers in before the trend reverses.
Key Merlin Chain Price Levels Now Decide If The Uptrend Survives
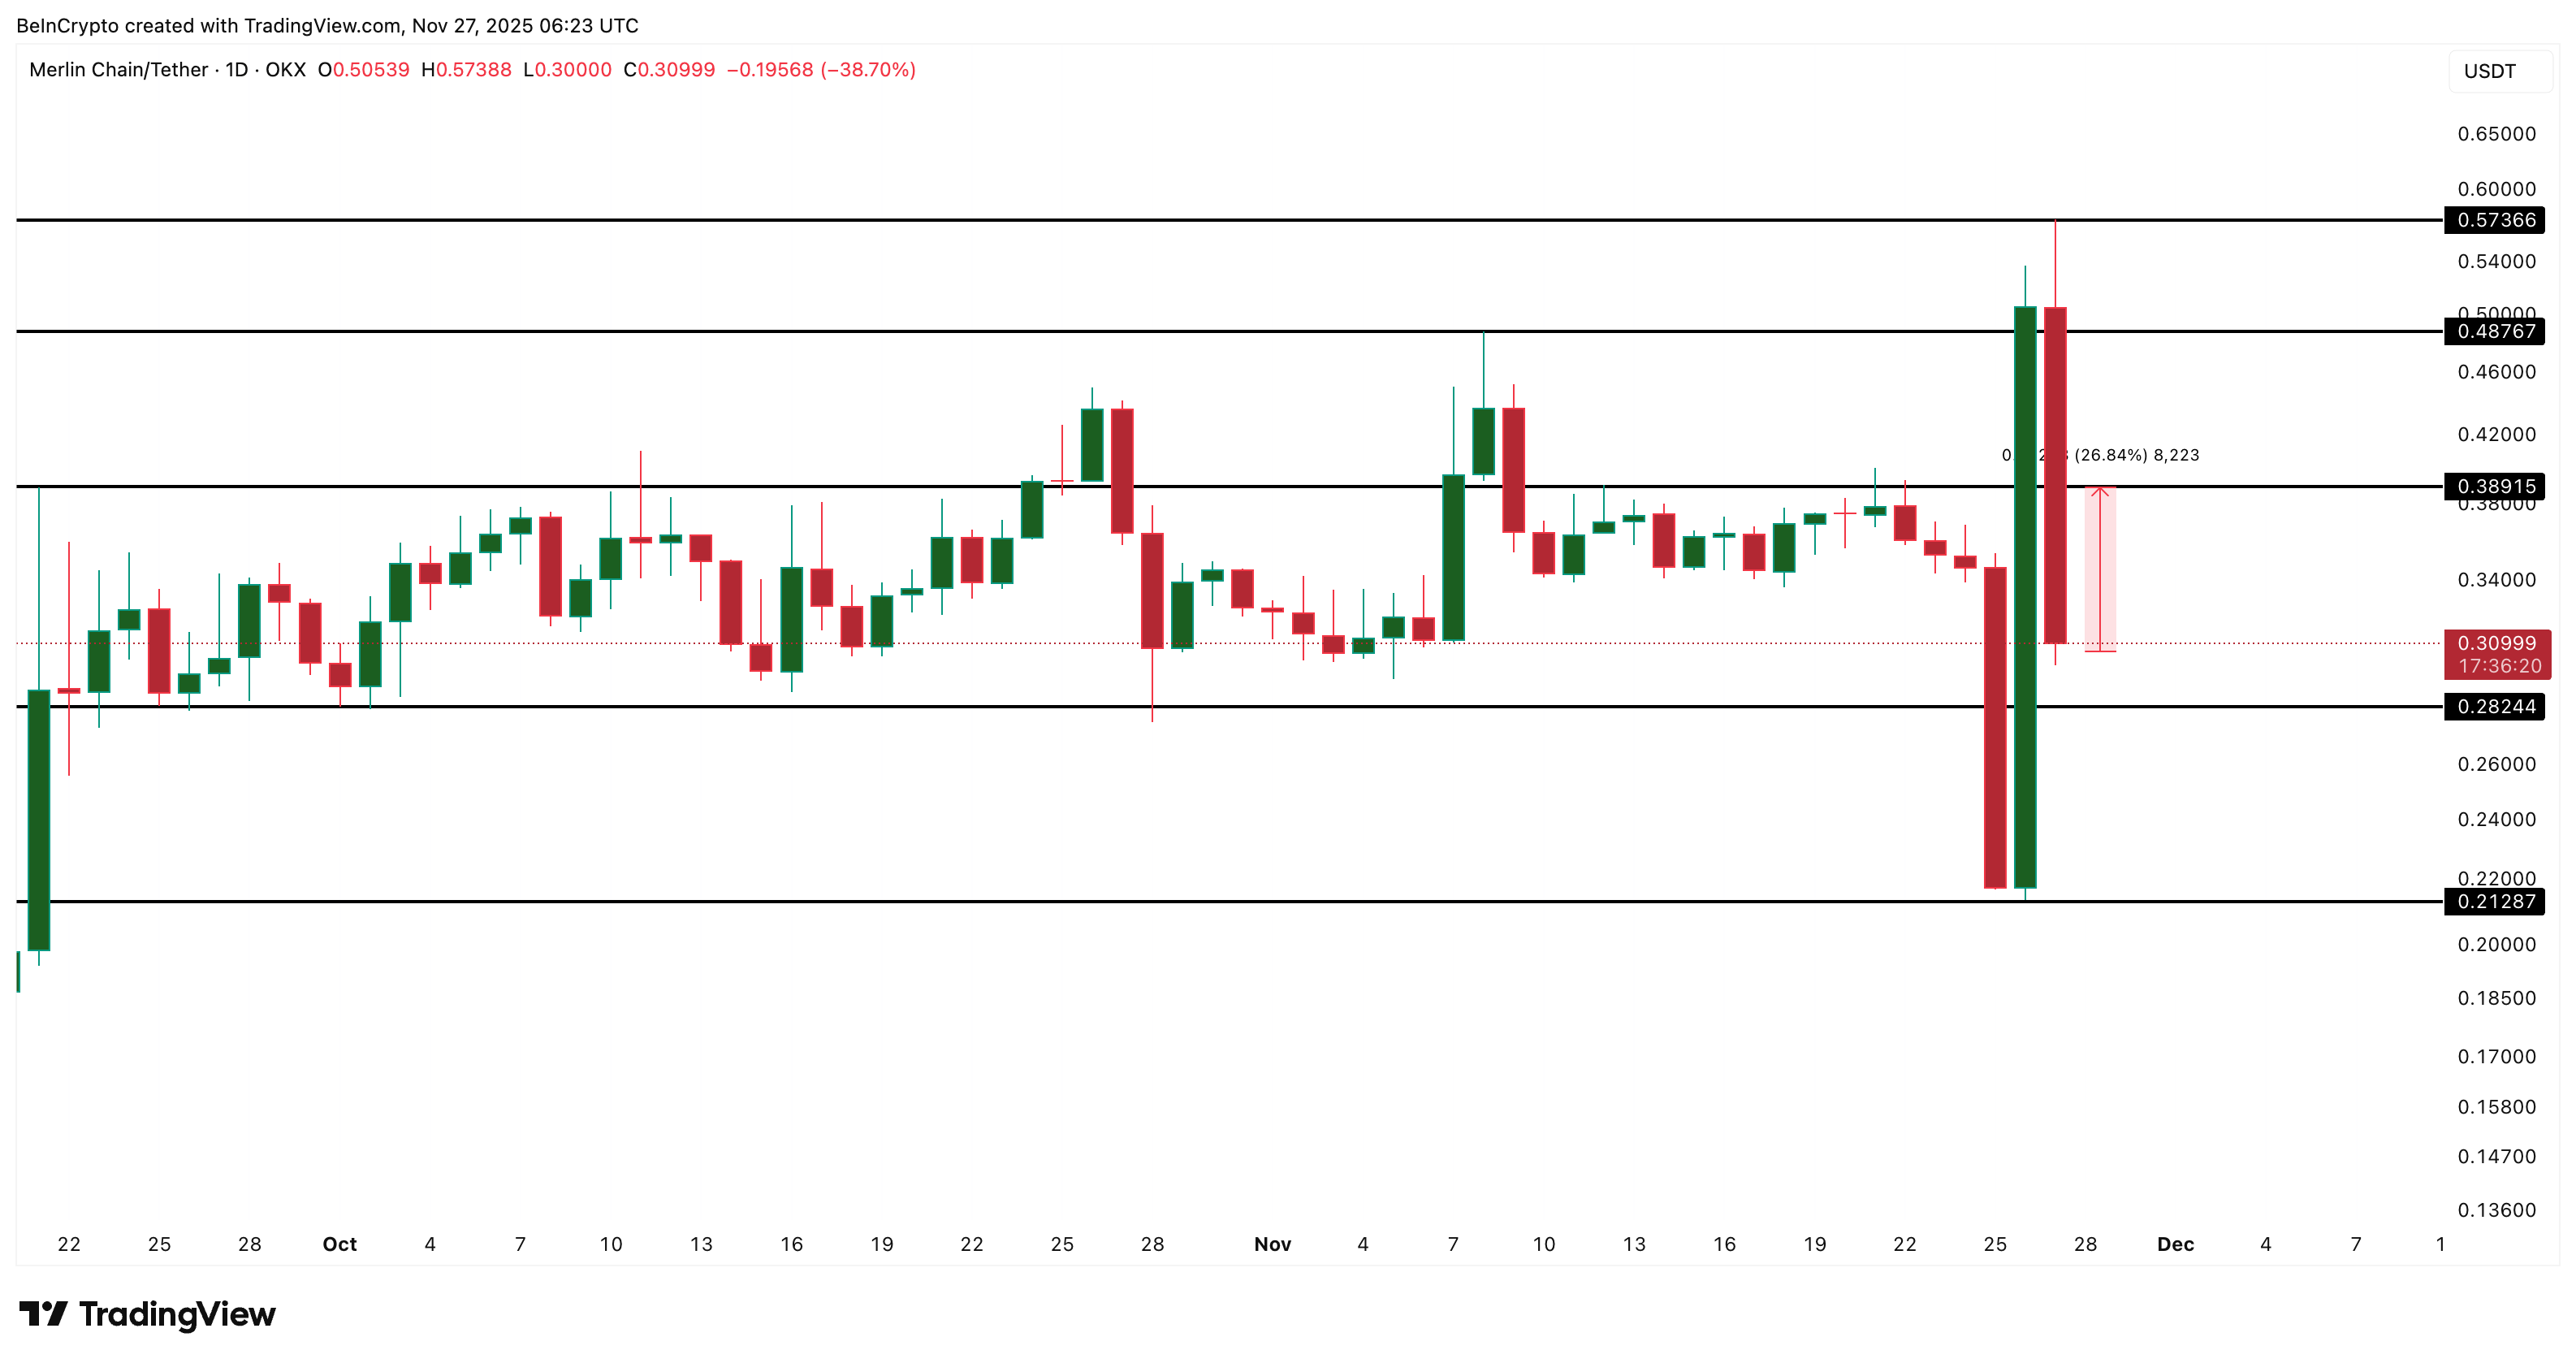
Now, the existing Merlin Chain price levels decide everything.
The first major resistance sits at $0.38. A clean daily close above $0.38 would weaken the divergence setup and let MERL aim for $0.48 and then $0.57, the near-term peak. That would be the signal that the broader rally from June still holds. However, the move would still need CMF support.
If MERL fails to clear $0.38 and falls under $0.28, the reversal setup grows stronger. The line that confirms the downtrend sits near $0.21. A daily close below $0.21 would complete a clear top and flip the whole three-month structure into a confirmed trend reversal.
 Merlin Chain Price Analysis:
TradingView
Merlin Chain Price Analysis:
TradingView
Right now, the message is straightforward. MERL’s 22% rally saved the short-term chart, but it also revealed that momentum and big-wallet demand are fading. If the key levels fail, this spike will be remembered not as a breakout, but as the move that confirmed the start of the downtrend. And it might even look like a “bull trap” for those who entered at $0.57 or nearby levels.
Read the article at BeInCryptoDisclaimer: The content of this article solely reflects the author's opinion and does not represent the platform in any capacity. This article is not intended to serve as a reference for making investment decisions.
You may also like
Public-Private Collaborations Driving Real Estate and Industrial Expansion in Webster, NY
- Webster , NY, leverages PPPs via FAST NY and NY Forward grants to boost infrastructure, real estate , and industrial investment. - Xerox campus upgrades and downtown revitalization projects enhance connectivity, attracting advanced manufacturing and logistics sectors. - $650M fairlife® facility creates 250 jobs, demonstrating how modernized infrastructure attracts high-value industries to secondary markets. - Websters model shows PPPs can drive sustainable growth by aligning public funding with private-s

The Influence of City Infrastructure Funding on Business Property and Economic Growth: Evaluating the $9.8 Million FAST NY Grant Awarded to Webster, NY as a M
- Webster , NY allocated a $9.8M FAST NY Grant to redevelop a 300-acre brownfield into a high-tech industrial hub, boosting land value appreciation. - Infrastructure upgrades including roads and sewer systems created shovel-ready sites, attracting manufacturers and aligning with Governor Hochul's economic strategy. - The project spurred 10.1% residential property value growth and 250 new jobs, though 2023 saw a 2.32% employment dip amid sector transitions. - Strategic proximity to I-390 and Rochester Airpo

Bitcoin Leverage Liquidation Dangers in 2025: Systemic Vulnerabilities Revealed Amid Market Volatility
- 2025 crypto market turmoil exposed systemic fragility in leveraged trading, with Bitcoin's 18.26% single-day crash triggering $19B in forced liquidations. - Macroeconomic pressures, liquidity collapse, and algorithmic deleveraging created self-reinforcing feedback loops, accelerating a $1.2T digital asset value drop. - Position concentration and exchange risk controls exacerbated cascading failures, with leveraged longs wiped out as open interest halved on major platforms. - Post-crash structural shifts

Ethereum Updates: Tom Lee Wagers on $9K ETH, Challenging $4B in Losses with a '2017 Bitcoin' Strategy
- Tom Lee predicts Ethereum (ETH) could hit $7,500–$9,000 by 2026, supported by Fundstrat's $83M ETH purchase and BitMine's 3.6M ETH accumulation (3% of supply). - Despite ETH trading below $3,000 (vs. $3,120 average cost), Lee views the dip as a buying opportunity, citing Ethereum's "Wall Street blockchain" utility and tokenization trends. - BitMine plans to stake its 3.6M ETH via MAVAN for 4–5% yields, aligning with Ethereum's DeFi growth and Grayscale's first U.S. spot Dogecoin ETF signaling crypto's in