This One Bearish Setup Could Flip Bitcoin’s Bottom Theory ‘Upside Down’

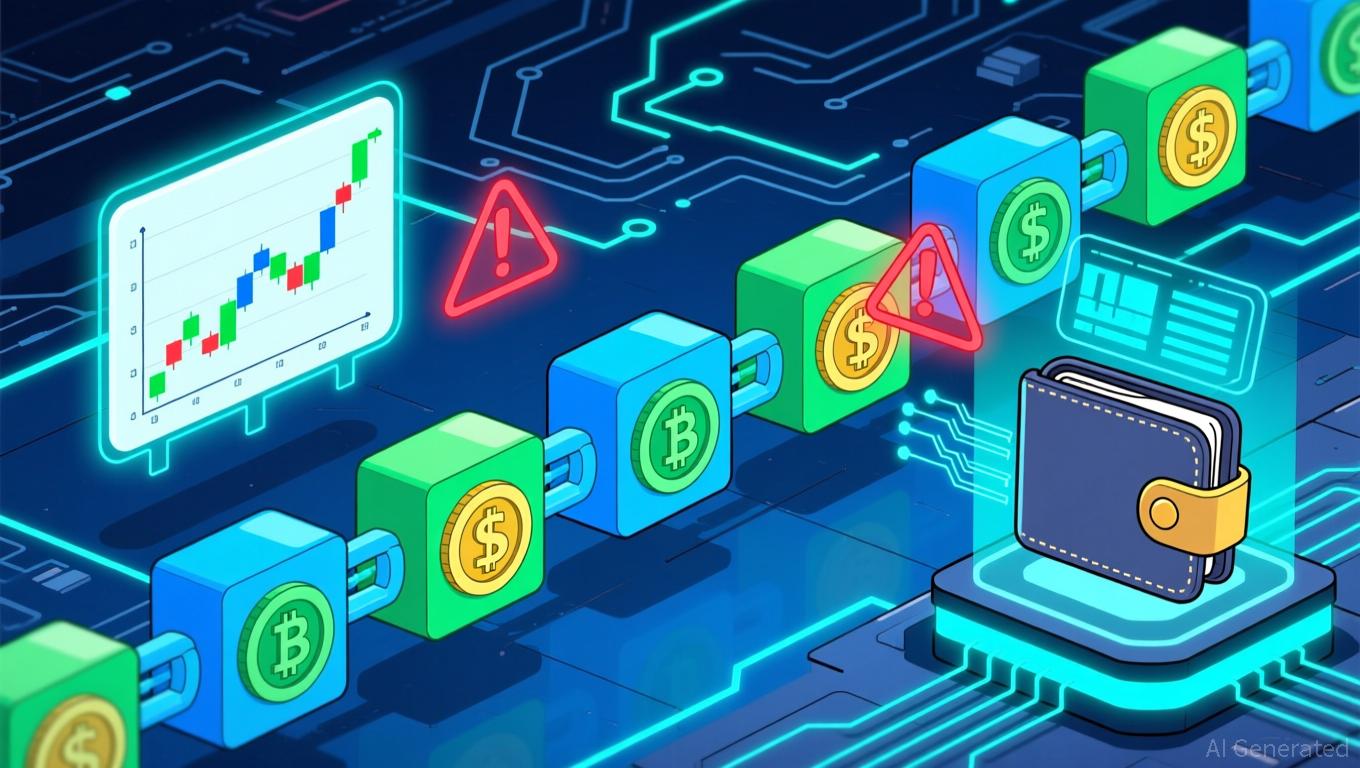
Bitcoin price failed to clear $88,100 with any conviction. It trades near $87,700, almost flat on the day, but still down more than 3% this week. The rebound from $80,500 gave traders some hope that a bottom had formed. But a few new signals now suggest that this bottom may be tested again or even
Bitcoin price failed to clear $88,100 with any conviction. It trades near $87,700, almost flat on the day, but still down more than 3% this week. The rebound from $80,500 gave traders some hope that a bottom had formed. But a few new signals now suggest that this bottom may be tested again or even broken.
The chart and on-chain data both point to the same risk: the recovery may not be ready yet.
Two Bearish Signals Still Favor The Downtrend
The first concern comes from the Relative Strength Index (RSI), which tracks momentum. Between 18 November and 24 November, Bitcoin made a lower high, but the RSI made a higher high. This is a hidden bearish divergence. It usually appears inside a downtrend and supports continuation rather than reversal.
 Hidden Bearish Divergence For BTC:
TradingView
Hidden Bearish Divergence For BTC:
TradingView
Want more token insights like this? Sign up for Editor Harsh Notariya’s Daily Crypto Newsletter here.
This aligns with the broader downtrend that began in early October. If the current divergence plays out, the next leg down could retest the recent lows again.
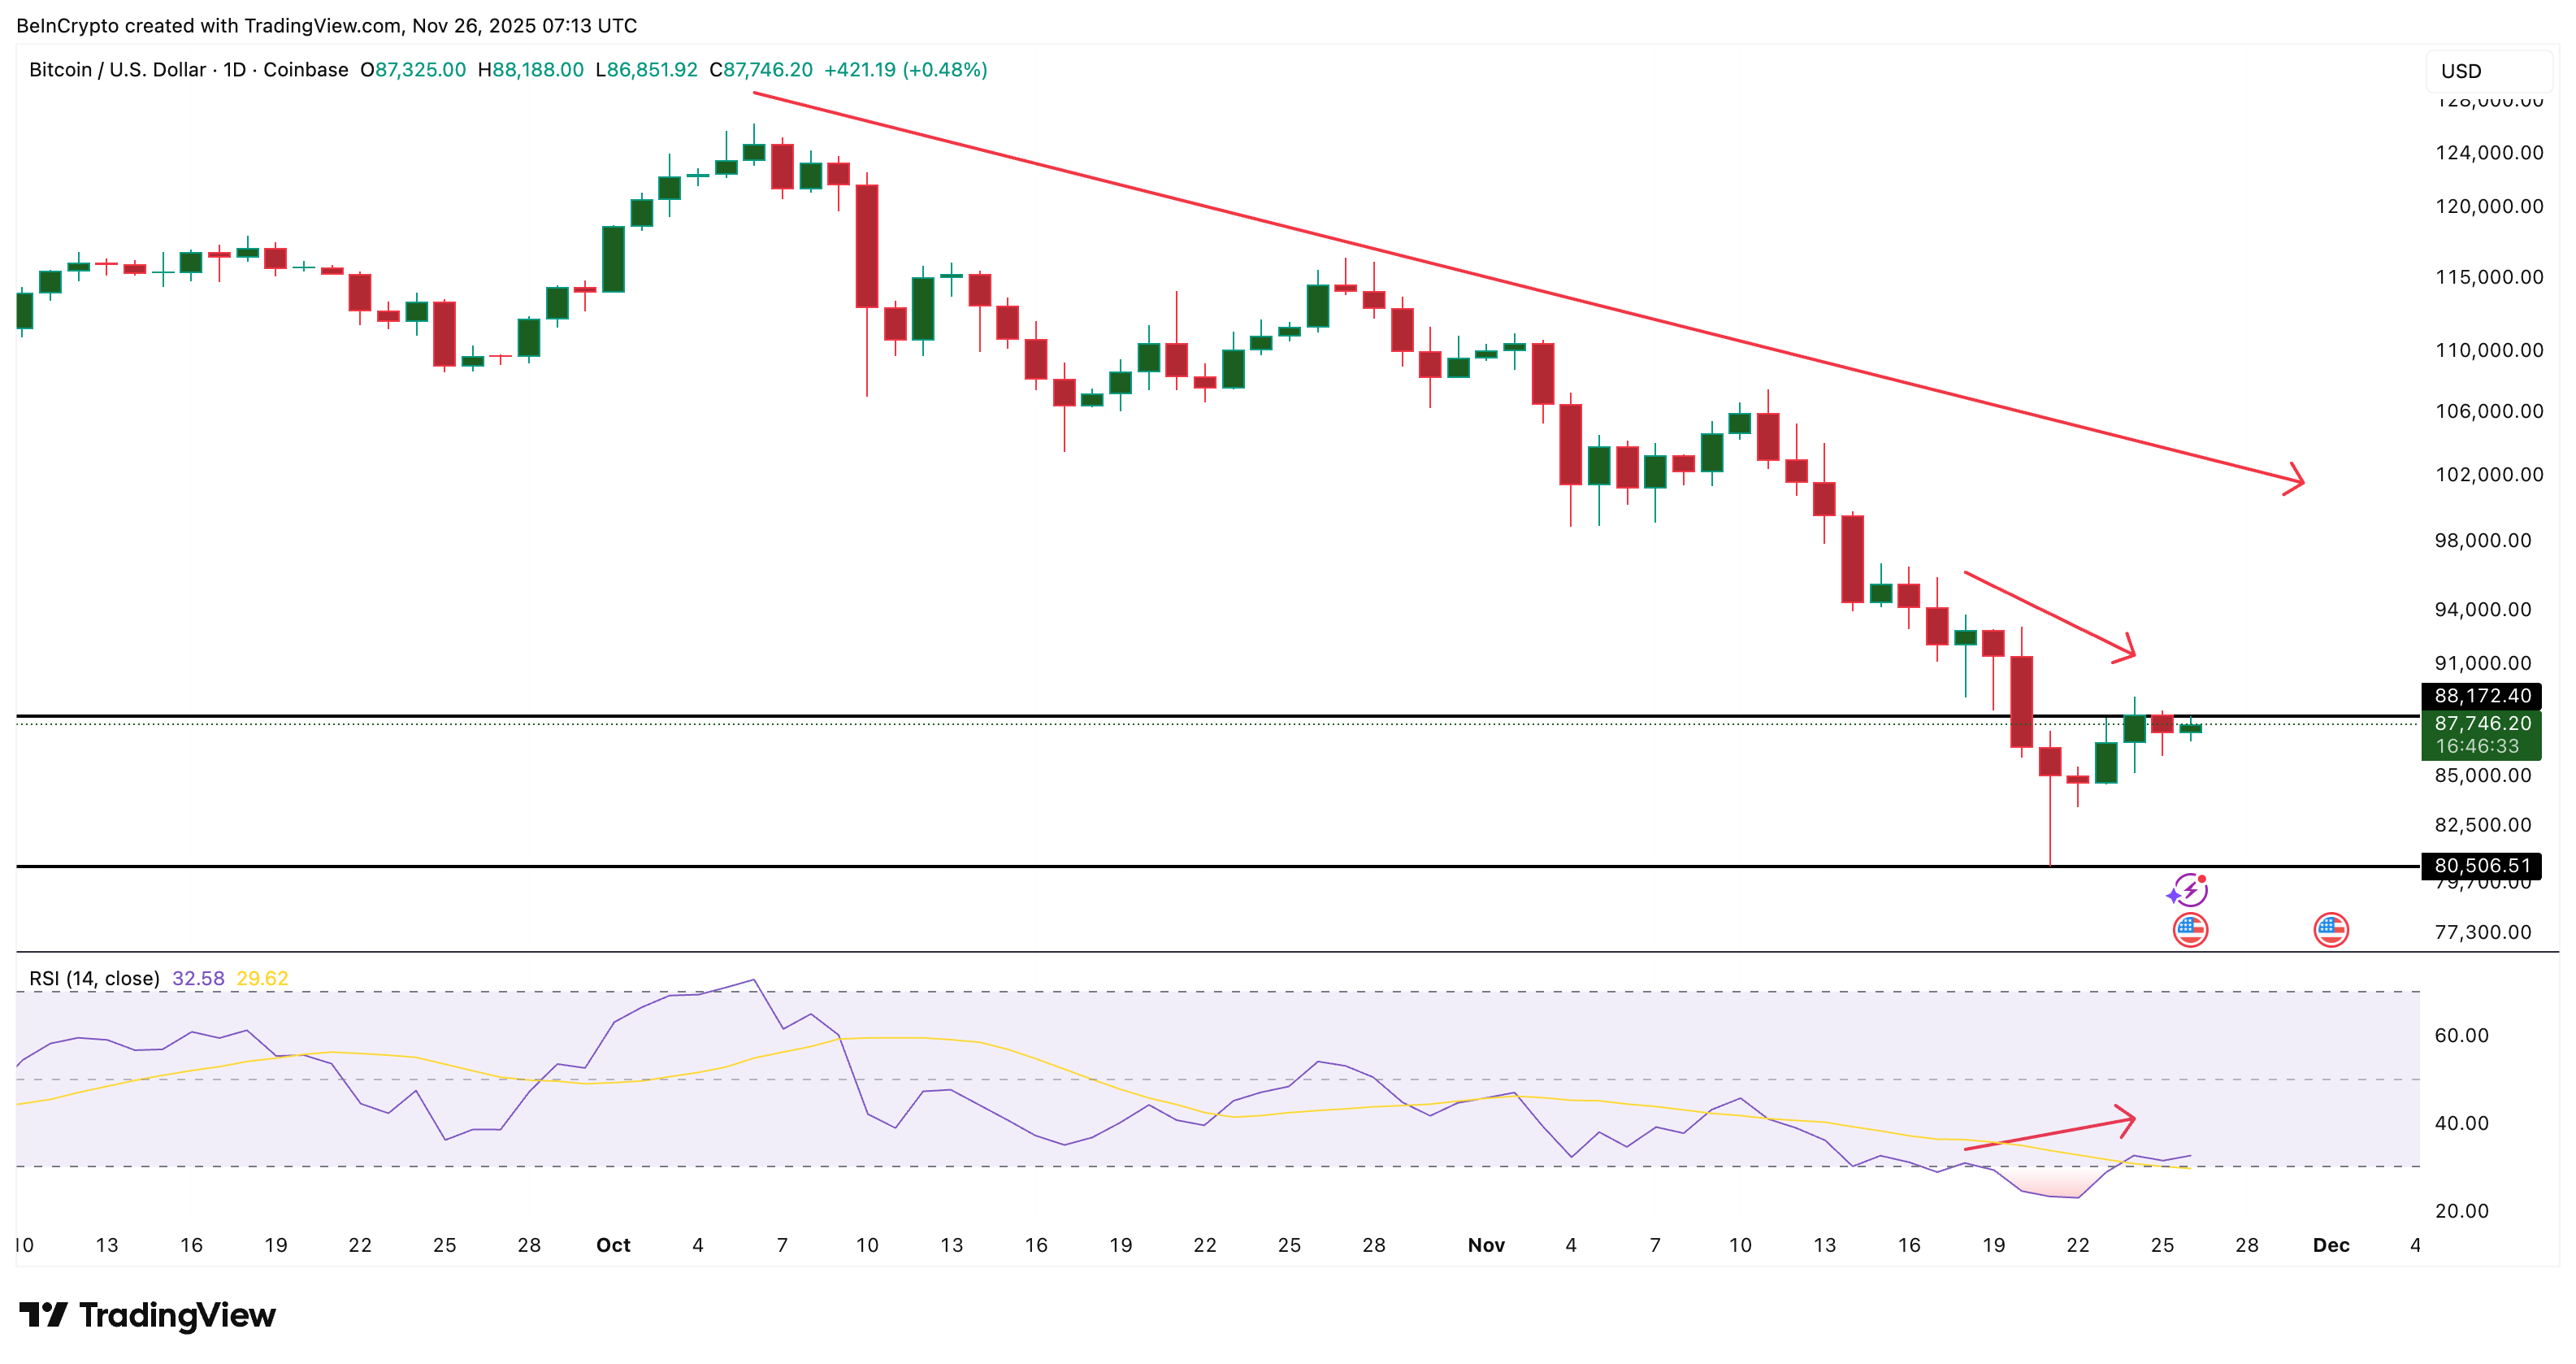
A second warning comes from the exponential moving averages (EMAs). EMAs are moving averages that give more weight to recent prices, so they react faster to trend changes.
The 100-day EMA has almost closed in on the 200-day EMA, forming a bearish crossover. A bearish crossover between these two averages often signals weakening trend structure.
 Bearish Crossover Looms:
TradingView
Bearish Crossover Looms:
TradingView
The fact that this crossover is forming near the $88,100 resistance makes the area even more important. If the crossover confirms while the Bitcoin price remains under that level, the recovery setup loses strength.
Whale Activity Adds Pressure To The Downside
On-chain data supports this caution. Wallets holding 1,000 to 10,000 BTC have been reducing their holdings since November 16. The count fell from 1,984 wallets to 1,962 as of November 25.
A similar decline in whale wallets happened earlier this month. Between November 1 and November 5, the wallet count dropped, and Bitcoin fell by almost 8% over the next few days.
 Whales Dumping:
Glassnode
Whales Dumping:
Glassnode
The same pattern has reappeared, only this time the price is much closer to its recent low. If whales continue trimming positions alongside the bearish signals on the chart, the BTC bottoming theory enters “upside-down” territory.
Key Bitcoin Price Levels To Watch
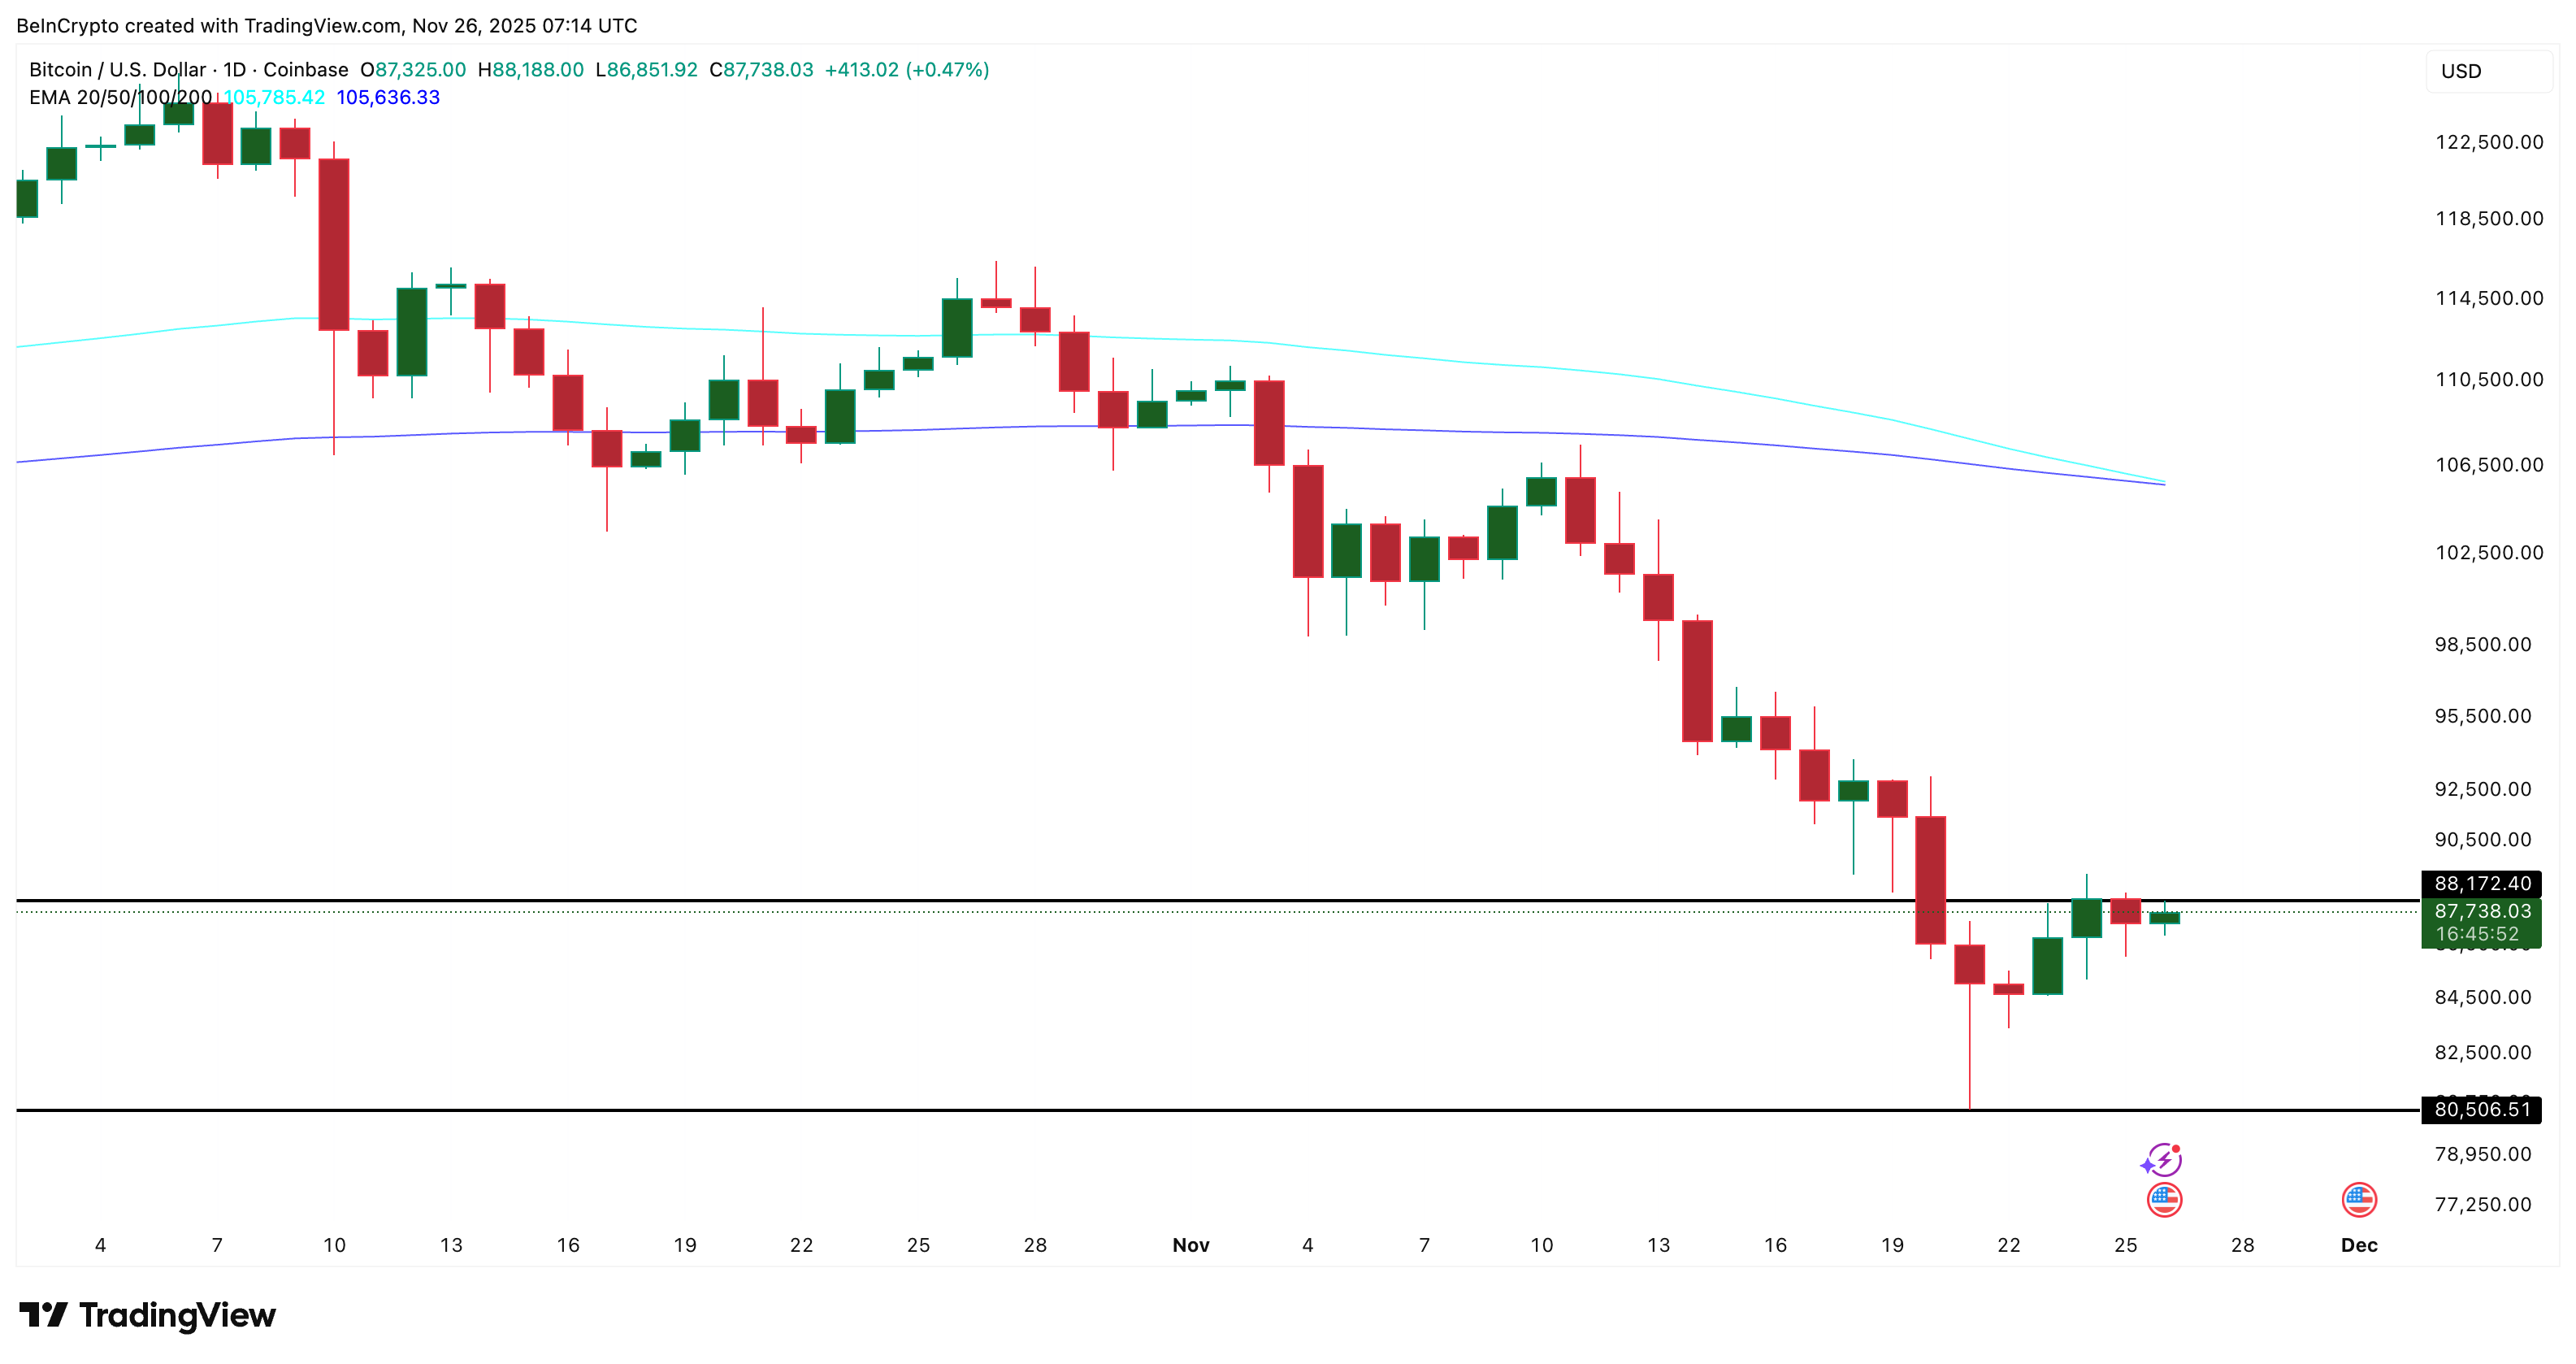
Bitcoin must break $88,100 with a clean daily close to weaken the divergence, possibly stop the EMA compression, and regain short-term control.
A strong move above that level opens the path toward $93,800, and, if momentum strengthens, $107,400. But those higher targets are unlikely for now while the current bearish signals remain active.
 Bitcoin Price Analysis:
TradingView
Bitcoin Price Analysis:
TradingView
On the downside, $80,500 is the key line. Losing it confirms an 8.32% drop from current levels, similar to the early-November whale-led drop.
It also signals that the previous low might not have been a true bottom. If that happens, the BTC bottoming process may stretch further into the cycle. Bitcoin has rebounded off its lows, but the bearish chart setup is clear.
Read the article at BeInCryptoDisclaimer: The content of this article solely reflects the author's opinion and does not represent the platform in any capacity. This article is not intended to serve as a reference for making investment decisions.
You may also like
Privacy Altcoins Surge While Crypto Markets Decline
In Brief Cryptocurrency markets faced a major downturn in recent weeks. Privacy altcoins like Zcash rise amidst stricter regulation concerns. Upcoming regulations pose liquidity risks for privacy-focused cryptocurrencies.

Solana News Today: Institutions Remain Confident in Solana Amid Security Concerns and Volatile Prices
- Solana's on-chain trading volume now exceeds centralized exchanges, driven by $510M in ETF inflows and institutional adoption of DeFi protocols. - Price volatility and security breaches, including Upbit's $36.8M Solana-based theft, highlight risks despite $3B+ in corporate treasury holdings. - Institutional capital continues to flow into Solana's ecosystem, with DWF Labs committing $75M to scalable DeFi infrastructure amid TVL recovery to $120B. - Forward Industries reports $668M unrealized losses as Sol
XRP News Today: XRP ETFs See Rapid Growth, Price Remains Flat—Will Increased Inflows Overcome Technical Barriers?
- XRP ETFs saw $164M inflows on Nov. 24, 2025, with Grayscale and Franklin Templeton launching new products amid rising institutional interest. - Price rebounded to $2.20 but remains range-bound below key technical levels, forming descending patterns despite ETF-driven liquidity gains. - Ripple's RLUSD stablecoin surged 56% in 30-day volume to $3.5B, now third-largest GENIUS Act-compliant stablecoin after USDC and PYUSD. - Analysts predict $5.05 by 2025 and $26.50 by 2030, but XRP's 16.95% drop from 30-day

SEC Considers Blockchain Stock Advancements as Concerns Over Conventional Market Stability Persist
- SEC plans to discuss tokenized stock regulations with major firms like Coinbase and BlackRock , aiming to modernize securities rules for blockchain-based finance. - Proposed "innovation exemption" seeks to fast-track crypto products but risks destabilizing traditional markets by creating valuation gaps and eroding investor protections. - WFE warns tokenized shares could disrupt market structure, while Nasdaq proposes unified order books with shared CUSIP identifiers to align with existing systems. - Regu