Bitget App
Trade smarter
Buy cryptoMarketsTradeFuturesEarnSquareMore
Solana (SOL) Dips To Test Key Support – Could This Pattern Trigger a Bounce Back?

Solana (SOL) Dips To Test Key Support – Could This Pattern Trigger a Bounce Back?

CoinsProbeCoinsProbe2025/11/19 08:27
By:Nilesh Hembade

Date: Wed, Nov 19, 2025 | 07:25 AM GMT

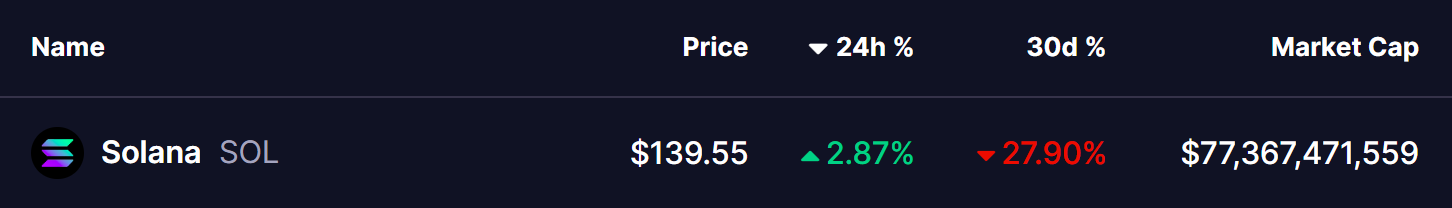
The broader crypto market remains under heavy selling pressure as Ethereum (ETH) extends its 30-day decline to over 26%. This weakness has spilled across major altcoins, and Solana (SOL) has not been spared — dropping nearly 27% in recent weeks.

However, beneath this sharp pullback, the chart is revealing an important technical setup that could be positioning SOL for a potential recovery.

Solana (SOL) Dips To Test Key Support – Could This Pattern Trigger a Bounce Back? image 0 Source: Coinmarketcap

Symmetrical Triangle in Play

On the weekly timeframe, SOL has been consolidating within a symmetrical triangle, a pattern that typically marks a period of tightening price action before a decisive breakout. This structure has been forming for months, with price compressing between converging trendlines.

The latest correction dragged SOL toward the triangle’s lower boundary, touching the support area near $128.81, which also aligns closely with a horizontal zone where buyers have previously stepped in. This confluence has triggered a fresh reaction from the bulls, keeping the trendline intact for now.

Solana (SOL) Dips To Test Key Support – Could This Pattern Trigger a Bounce Back? image 1 
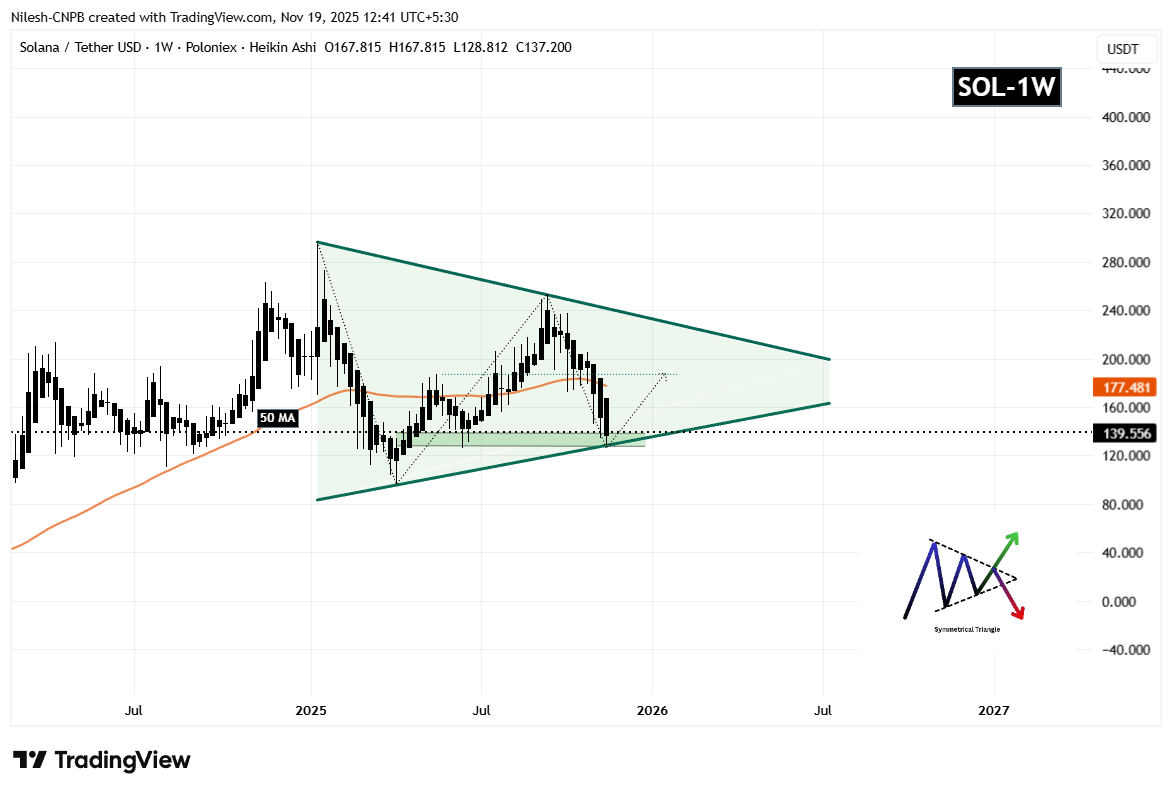
Solana (SOL) Weekly Chart/Coinsprobe (Source: Tradingview)

SOL is currently trading around $139.55, positioned just above this key support but still sitting below the 50-week moving average (MA) at $177.48 — a level that has consistently acted as resistance and remains the first major hurdle for any sustainable rebound.

If SOL manages to reclaim the 50-week MA, it would be one of the earliest signals of renewed bullish momentum.

What’s Next for SOL?

If the ascending support trendline continues to hold, SOL may attempt a move back toward the triangle’s descending resistance line, gradually tightening price action as it approaches an eventual breakout point.

There is also a developing possibility of the right shoulder of a head-and-shoulders formation forming at this support region. If that structure plays out, it could fuel an upside push toward the 50-week MA around $177, which aligns with the logical neckline area of the pattern.

However, the risk remains clear. A strong breakdown below the symmetrical triangle support could invalidate the bullish scenario, paving the way for deeper downside levels and prolonging the corrective phase.

For now, SOL’s reaction at this support zone is crucial. As long as buyers defend the lower boundary, the potential for a recovery bounce remains alive.

0
0

Disclaimer: The content of this article solely reflects the author's opinion and does not represent the platform in any capacity. This article is not intended to serve as a reference for making investment decisions.

PoolX: Earn new token airdrops
Lock your assets and earn 10%+ APR
Lock now!

You may also like

The HYPE Token Crypto Rally: Unveiling the Driving Force Behind Its Week-Long Surge

- HYPE Token's 7-day surge in late 2025, reaching $35.08, was driven by protocol upgrades, institutional backing, and retail FOMO. - Institutional investments like Paradigm’s $581M stake and retail-driven momentum mirrored the 2021 Dogecoin rally. - However, looming token unlocks and bearish indicators, including a $11B unlock of 237M tokens, raised sustainability concerns. - Technical analysis showed mixed signals, with consolidation near support levels and short-term volatility risks, while broader trend

Bitget-RWA2025/12/16 05:58
The HYPE Token Crypto Rally: Unveiling the Driving Force Behind Its Week-Long Surge

How CFTC-Recognized Platforms Such as CleanTrade Are Transforming the Landscape of Clean Energy Investments

- CFTC-approved CleanTrade introduces a regulated SEF for clean energy derivatives, addressing market fragmentation and liquidity gaps. - The platform enables institutional-scale trading of vPPAs/RECs, achieving $16B notional volume in two months by aggregating demand/supply. - Integrated risk analytics (e.g., CleanSight) enhance transparency, allowing investors to hedge project-specific risks like grid congestion and curtailment. - Dual investment pathways attract hedge funds/pension funds through direct

Bitget-RWA2025/12/16 05:26
How CFTC-Recognized Platforms Such as CleanTrade Are Transforming the Landscape of Clean Energy Investments

The Rise of CFTC-Regulated Clean Energy Markets: Opening a New Chapter for Institutional Investors

- CFTC's 2025 approval of REsurety's CleanTrade as a SEF marks a landmark shift in clean energy markets by introducing standardized, transparent trading for VPPAs and RECs. - The platform attracted $16B in notional value within two months, enabling rapid institutional-grade transactions that previously took months to negotiate. - By addressing liquidity gaps and enabling precise risk modeling, CleanTrade is accelerating capital flows into decarbonization while bridging ESG investment gaps for institutional

Bitget-RWA2025/12/16 04:44
The Rise of CFTC-Regulated Clean Energy Markets: Opening a New Chapter for Institutional Investors

The Increasing Overlap Between Health and Financial Wellbeing in Managing Personal Finances

- Global wellness economy to hit $9 trillion by 2028, driven by holistic well-being trends. - Millennials/Gen Z prioritize wellness as lifestyle, with 55% spending over $100/month on health. - Employers integrate financial wellness into health programs to reduce burnout and boost productivity. - Investors target wellness-driven SaaS, healthcare tech , and financial literacy platforms for holistic solutions.

Bitget-RWA2025/12/16 04:22
The Increasing Overlap Between Health and Financial Wellbeing in Managing Personal Finances
© 2025 Bitget