
Ethereum’s Momentum Stalls as ETH Lags Behind Bitcoin – $5,000 Target on Hold

Ethereum’s rally momentum fades as its correlation with Bitcoin weakens and inflows slow. Traders eye $4,211 support or a potential rebound toward $4,957 if demand recovers.
Leading altcoin Ethereum is showing signs of underperformance against Bitcoin (BTC) as its relative strength with the leading digital asset has weakened over the past few sessions.
Despite BTC reaching new all-time highs yesterday, ETH’s price has struggled to follow, trading sideways over the last four days. Technical indicators point to muted buying interest, raising concerns that the coin could see further downside if momentum fails to pick up.
Ethereum Weakens Against Bitcoin
ETH’s ratio against BTC (ETH/BTC) has been trending lower over the past few days, highlighting that Ethereum is losing ground to Bitcoin in relative performance. At press time, this currently stands at 0.036.
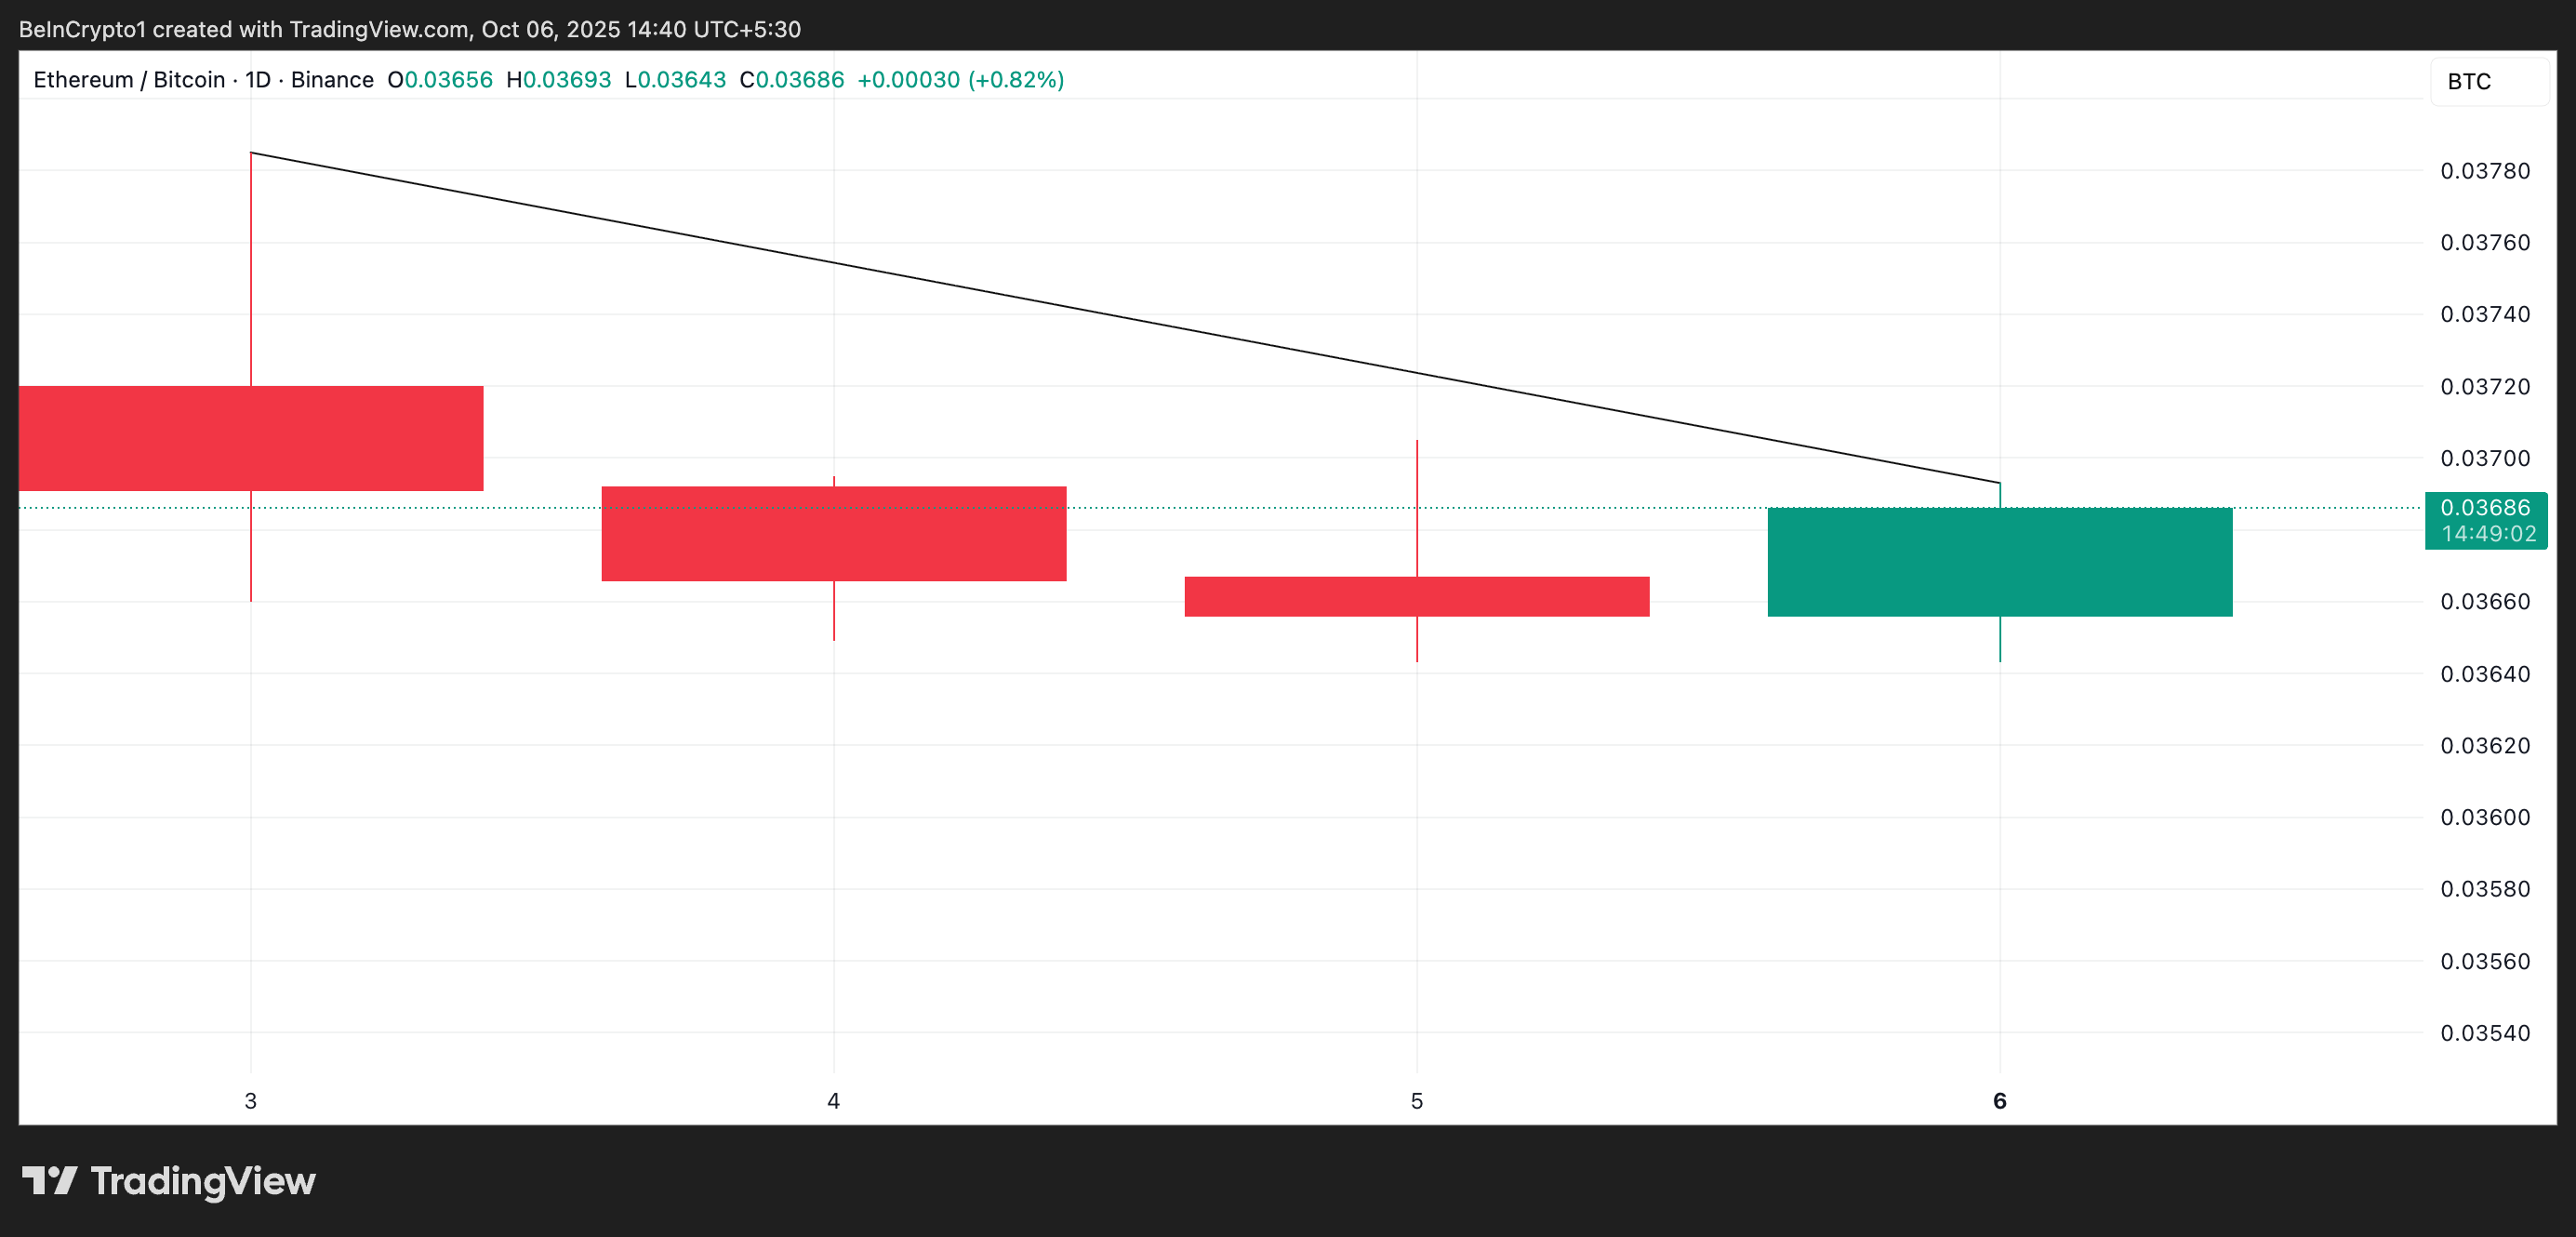 ETH/BTC Ratio. Source:
TradingView
ETH/BTC Ratio. Source:
TradingView
The ETH/BTC ratio measures the relative strength of ETH compared to BTC, showing how much the former is worth in terms of the latter and indicating which asset outperforms the other.
When it falls like this, it signals that ETH is underperforming Bitcoin. As a result, BTC’s recent rally to new all-time highs may not be enough to lift ETH. This leaves the altcoin’s price more vulnerable to sideways or downward pressure over the next few trading sessions.
Moreover, ETH’s Chaikin Money Flow (CMF) on the daily chart has flattened over the past few sessions and has begun trending downward. This signals that capital inflows into ETH have slowed, further delaying the likelihood of a surge toward $5000.
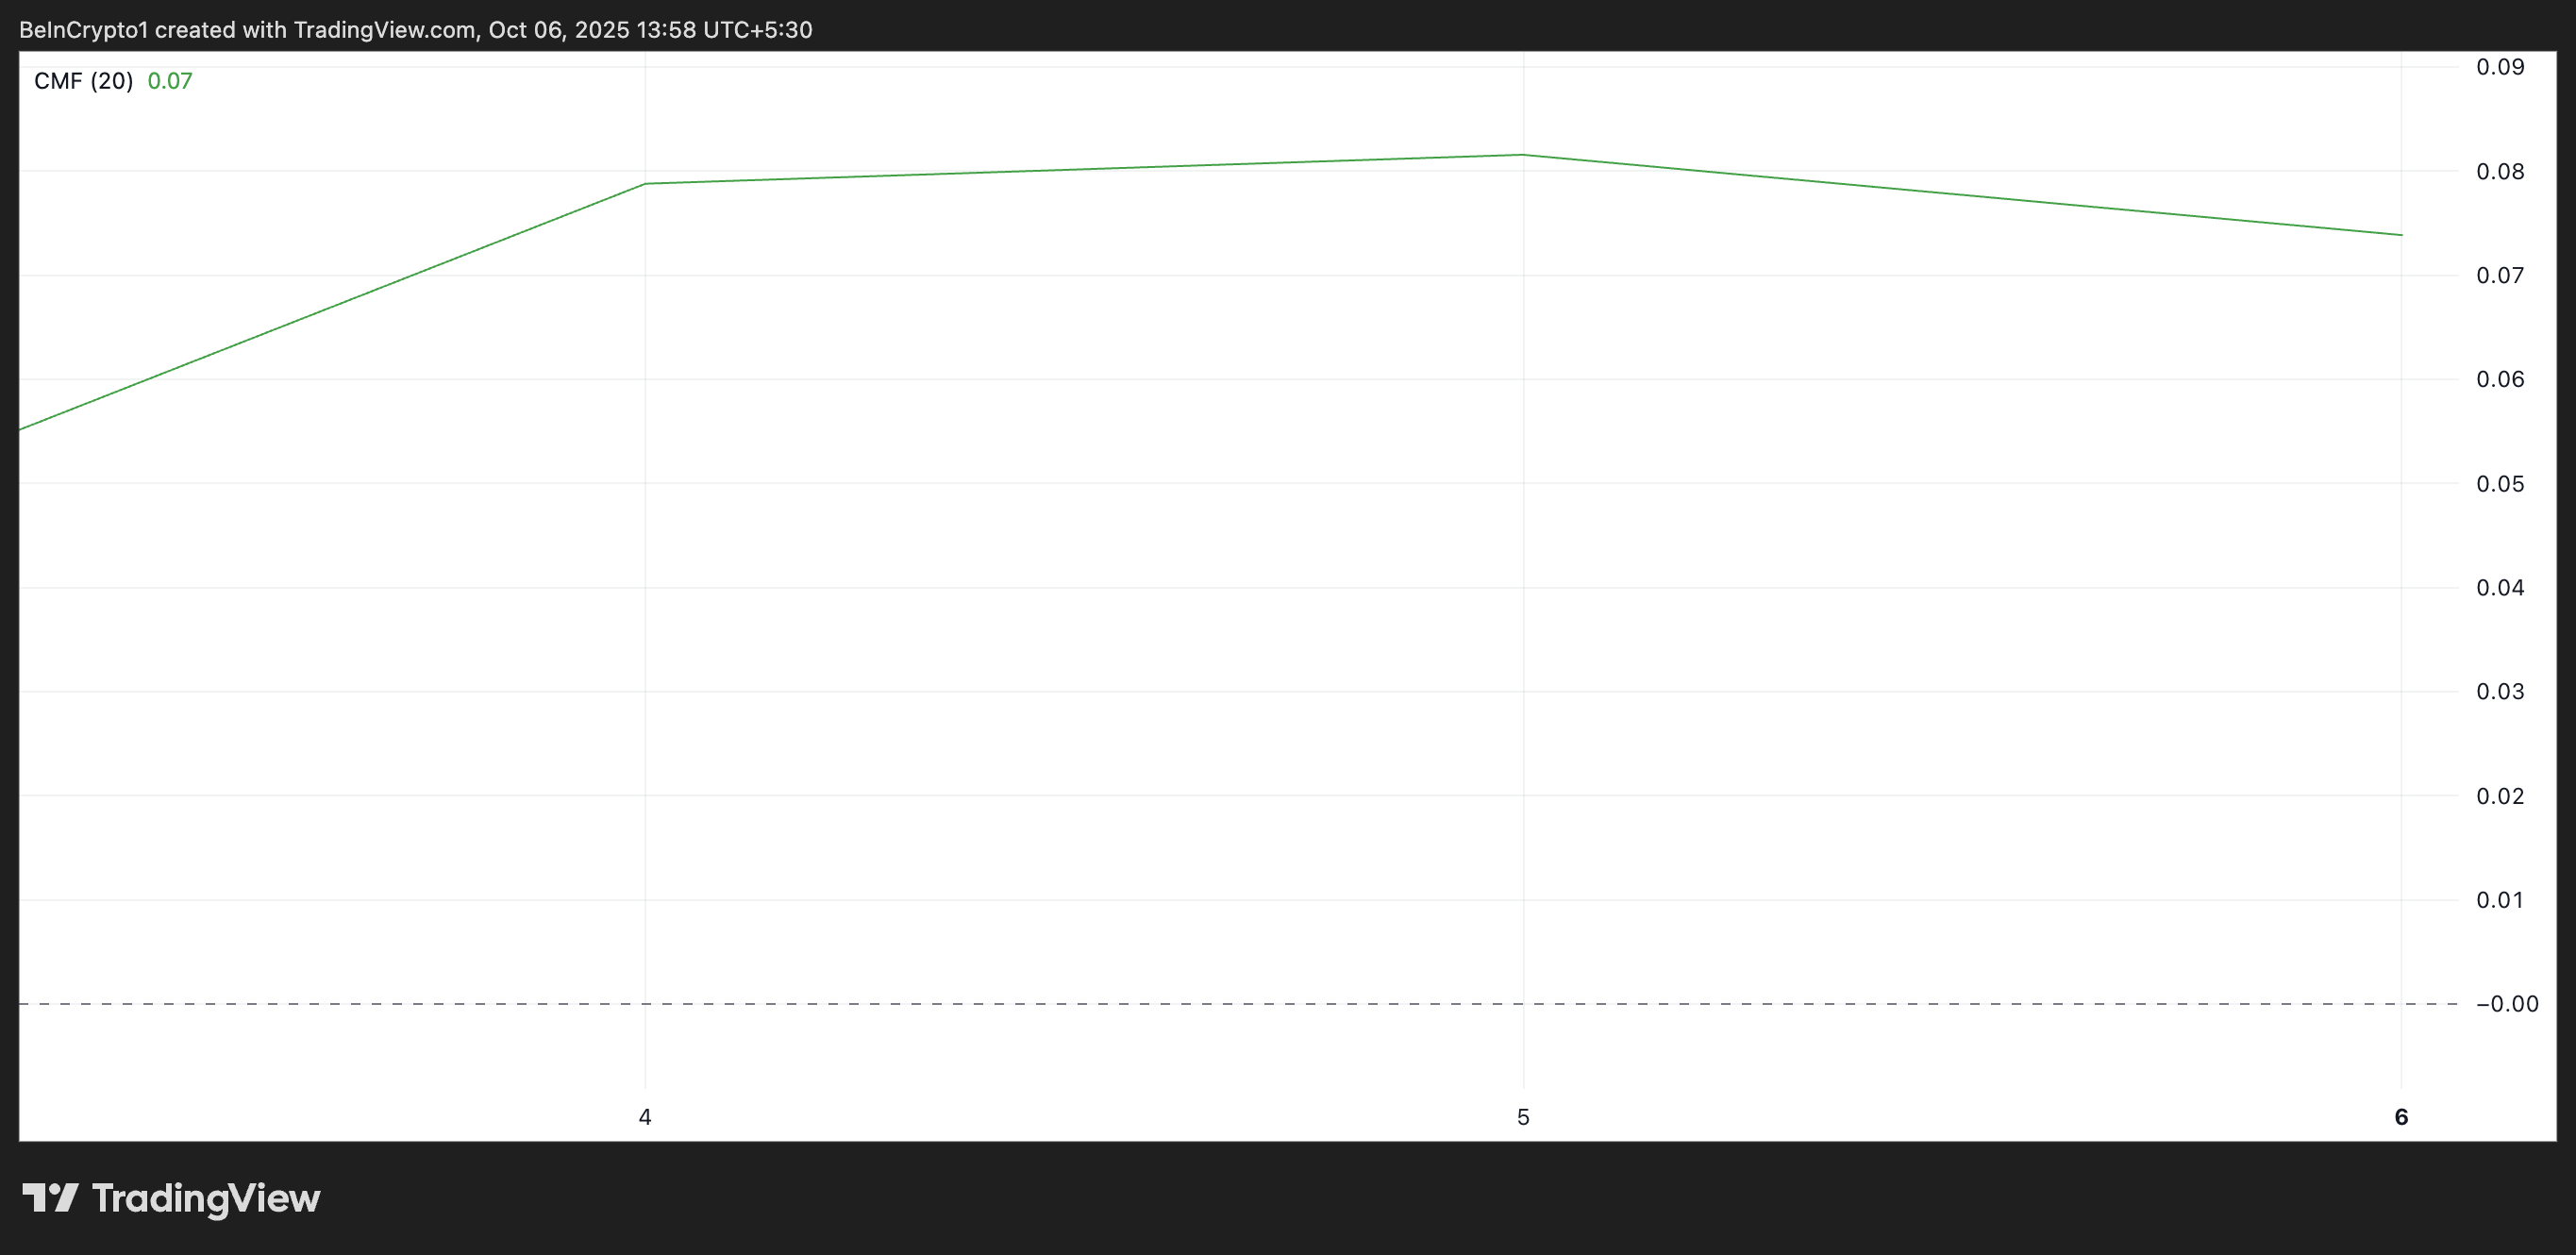 ETH Chaikin Money Flow. Source:
TradingView
ETH Chaikin Money Flow. Source:
TradingView
The CMF indicator measures how money flows into and out of an asset. When it flattens, then falls, it signals weakening buying pressure and potential selling momentum. This further confirms that ETH may struggle to gain upward traction even as BTC rallies.
Ethereum Stalls Amid Market Uncertainty: $4,211 or $4,957 Next?
A sideways trend accompanied by a flattening momentum indicator reflects indecision among traders, with neither buyers nor sellers fully in control. If downward pressure strengthens, this could set the stage for a larger correction.
In this scenario, the coin’s price could plummet toward $4,211.
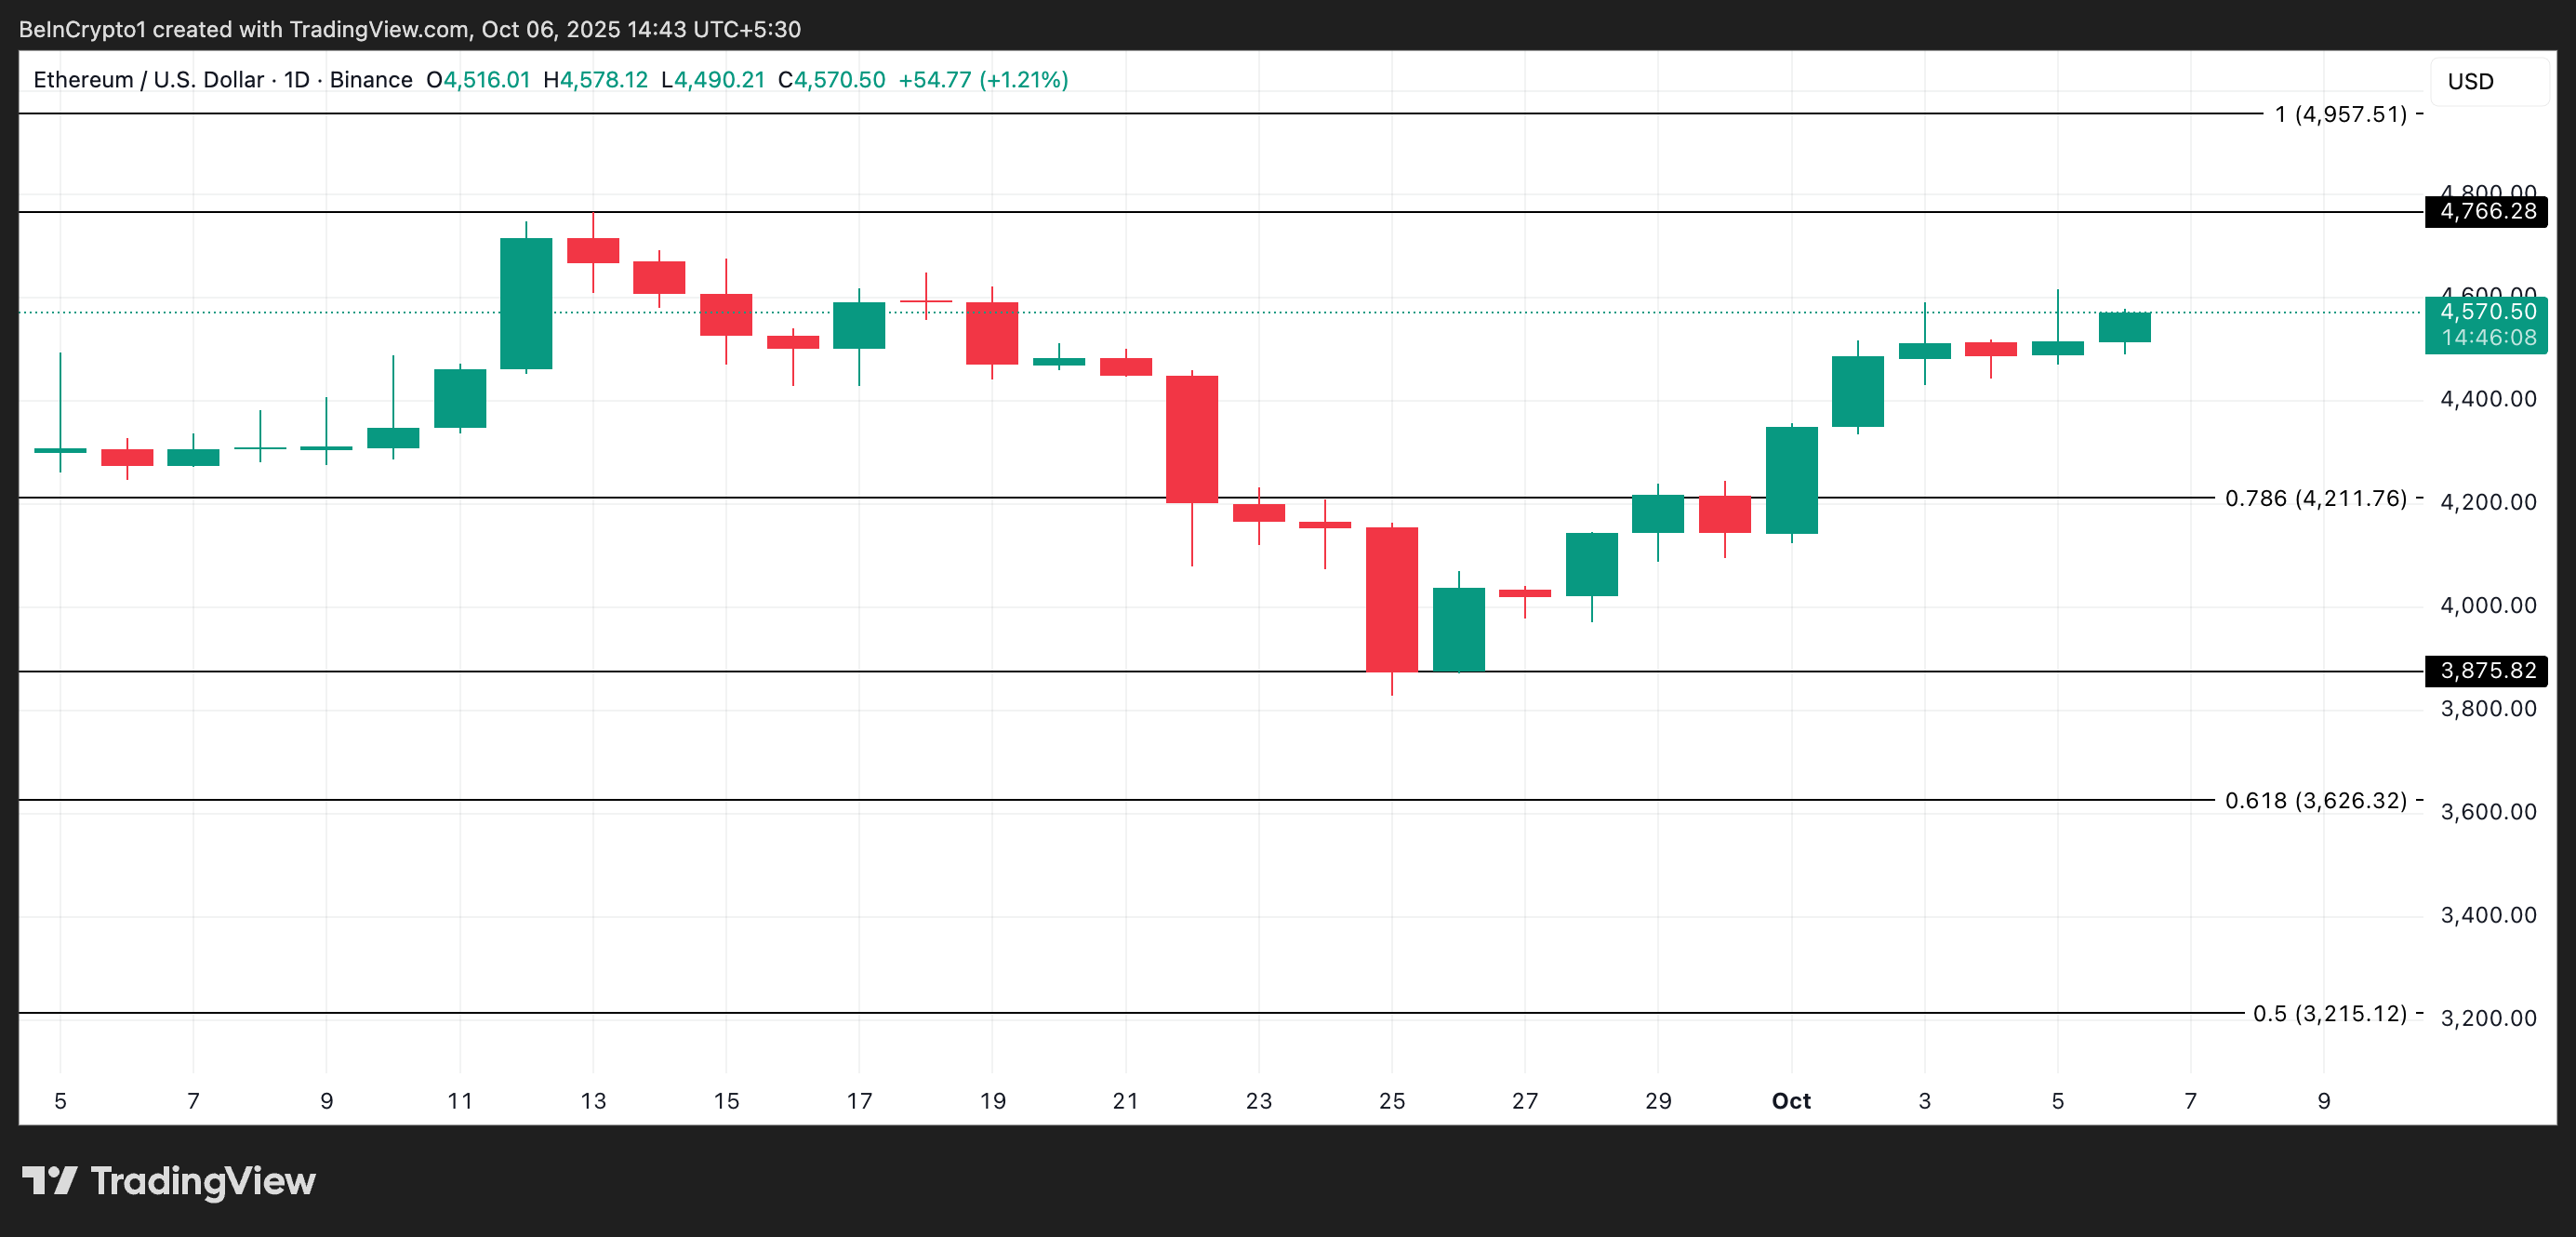 ETH Price Analysis. Source:
TradingView
ETH Price Analysis. Source:
TradingView
On the other hand, if the bull-side power grows, ETH could attempt a rally toward its all-time high of $4,957, last reached on August 24. But for this to happen, ETH’s price must first breach the immediate resistance at $4,766.
Disclaimer: The content of this article solely reflects the author's opinion and does not represent the platform in any capacity. This article is not intended to serve as a reference for making investment decisions.
You may also like
After bitcoin returns to $90,000, is Christmas or a Christmas crash coming next?
This Thanksgiving, we are grateful for bitcoin returning to $90,000.

Bitcoin security reaches a historic high, but miner revenue drops to a historic low. Where will mining companies find new sources of income?
The current paradox of the Bitcoin network is particularly striking: while the protocol layer has never been more secure due to high hash power, the underlying mining industry is facing pressure from capital liquidation and consolidation.

What are the privacy messaging apps Session and SimpleX donated by Vitalik?
Why did Vitalik take action? From content encryption to metadata privacy.

The covert war escalates: Hyperliquid faces a "kamikaze" attack, but the real battle may have just begun
The attacker incurred a loss of 3 million in a "suicidal" attack, but may have achieved breakeven through external hedging. This appears more like a low-cost "stress test" targeting the protocol's defensive capabilities.
