

SHIB/USD is currently trading near $0.00001218 with a slight 1.18% daily increase, but it faces key resistance at $0.00001220. Market volatility is low, limiting short-term upward momentum.
-
SHIB price increased by 1.18% over the last 24 hours, showing modest bullish momentum.
-
The hourly chart reveals a false breakout at $0.00001223, indicating resistance pressure.
-
According to COINOTAG analysis, if the daily close surpasses $0.00001220, SHIB may test $0.00001250 soon.
SHIB/USD price analysis highlights resistance at $0.00001220 with limited volatility; stay updated with COINOTAG for market insights and trading strategies.
SHIB/USD Price Trends and Resistance Levels
The SHIB/USD pair has experienced a 1.18% price increase in the last 24 hours, reflecting cautious optimism among traders. Despite this uptick, the hourly chart shows a false breakout above the local resistance at $0.00001223, signaling that upward momentum is currently constrained. Most of the daily Average True Range (ATR) has already been consumed, suggesting that volatility is unlikely to increase significantly in the short term.
What Does the Midterm Outlook Indicate for SHIB?
From a broader perspective, SHIB’s price action remains less bullish. The coin has repeatedly bounced off the resistance near $0.00001173, indicating strong selling pressure at this level. If the price fails to close above $0.00001220 by the end of the day, there is a high probability that SHIB will test lower support around $0.000010. This outlook aligns with COINOTAG’s market analysis, which emphasizes the importance of monitoring daily closes for trend confirmation.
Top coins by CoinStats
How Does SHIB’s Volatility Affect Trading Strategies?
Given that most of the daily ATR has been exhausted, traders should expect limited price swings in the immediate future. This low volatility environment often leads to consolidation phases, where SHIB trades within a narrow range. COINOTAG experts recommend cautious trading during such periods, focusing on key resistance and support levels to manage risk effectively.
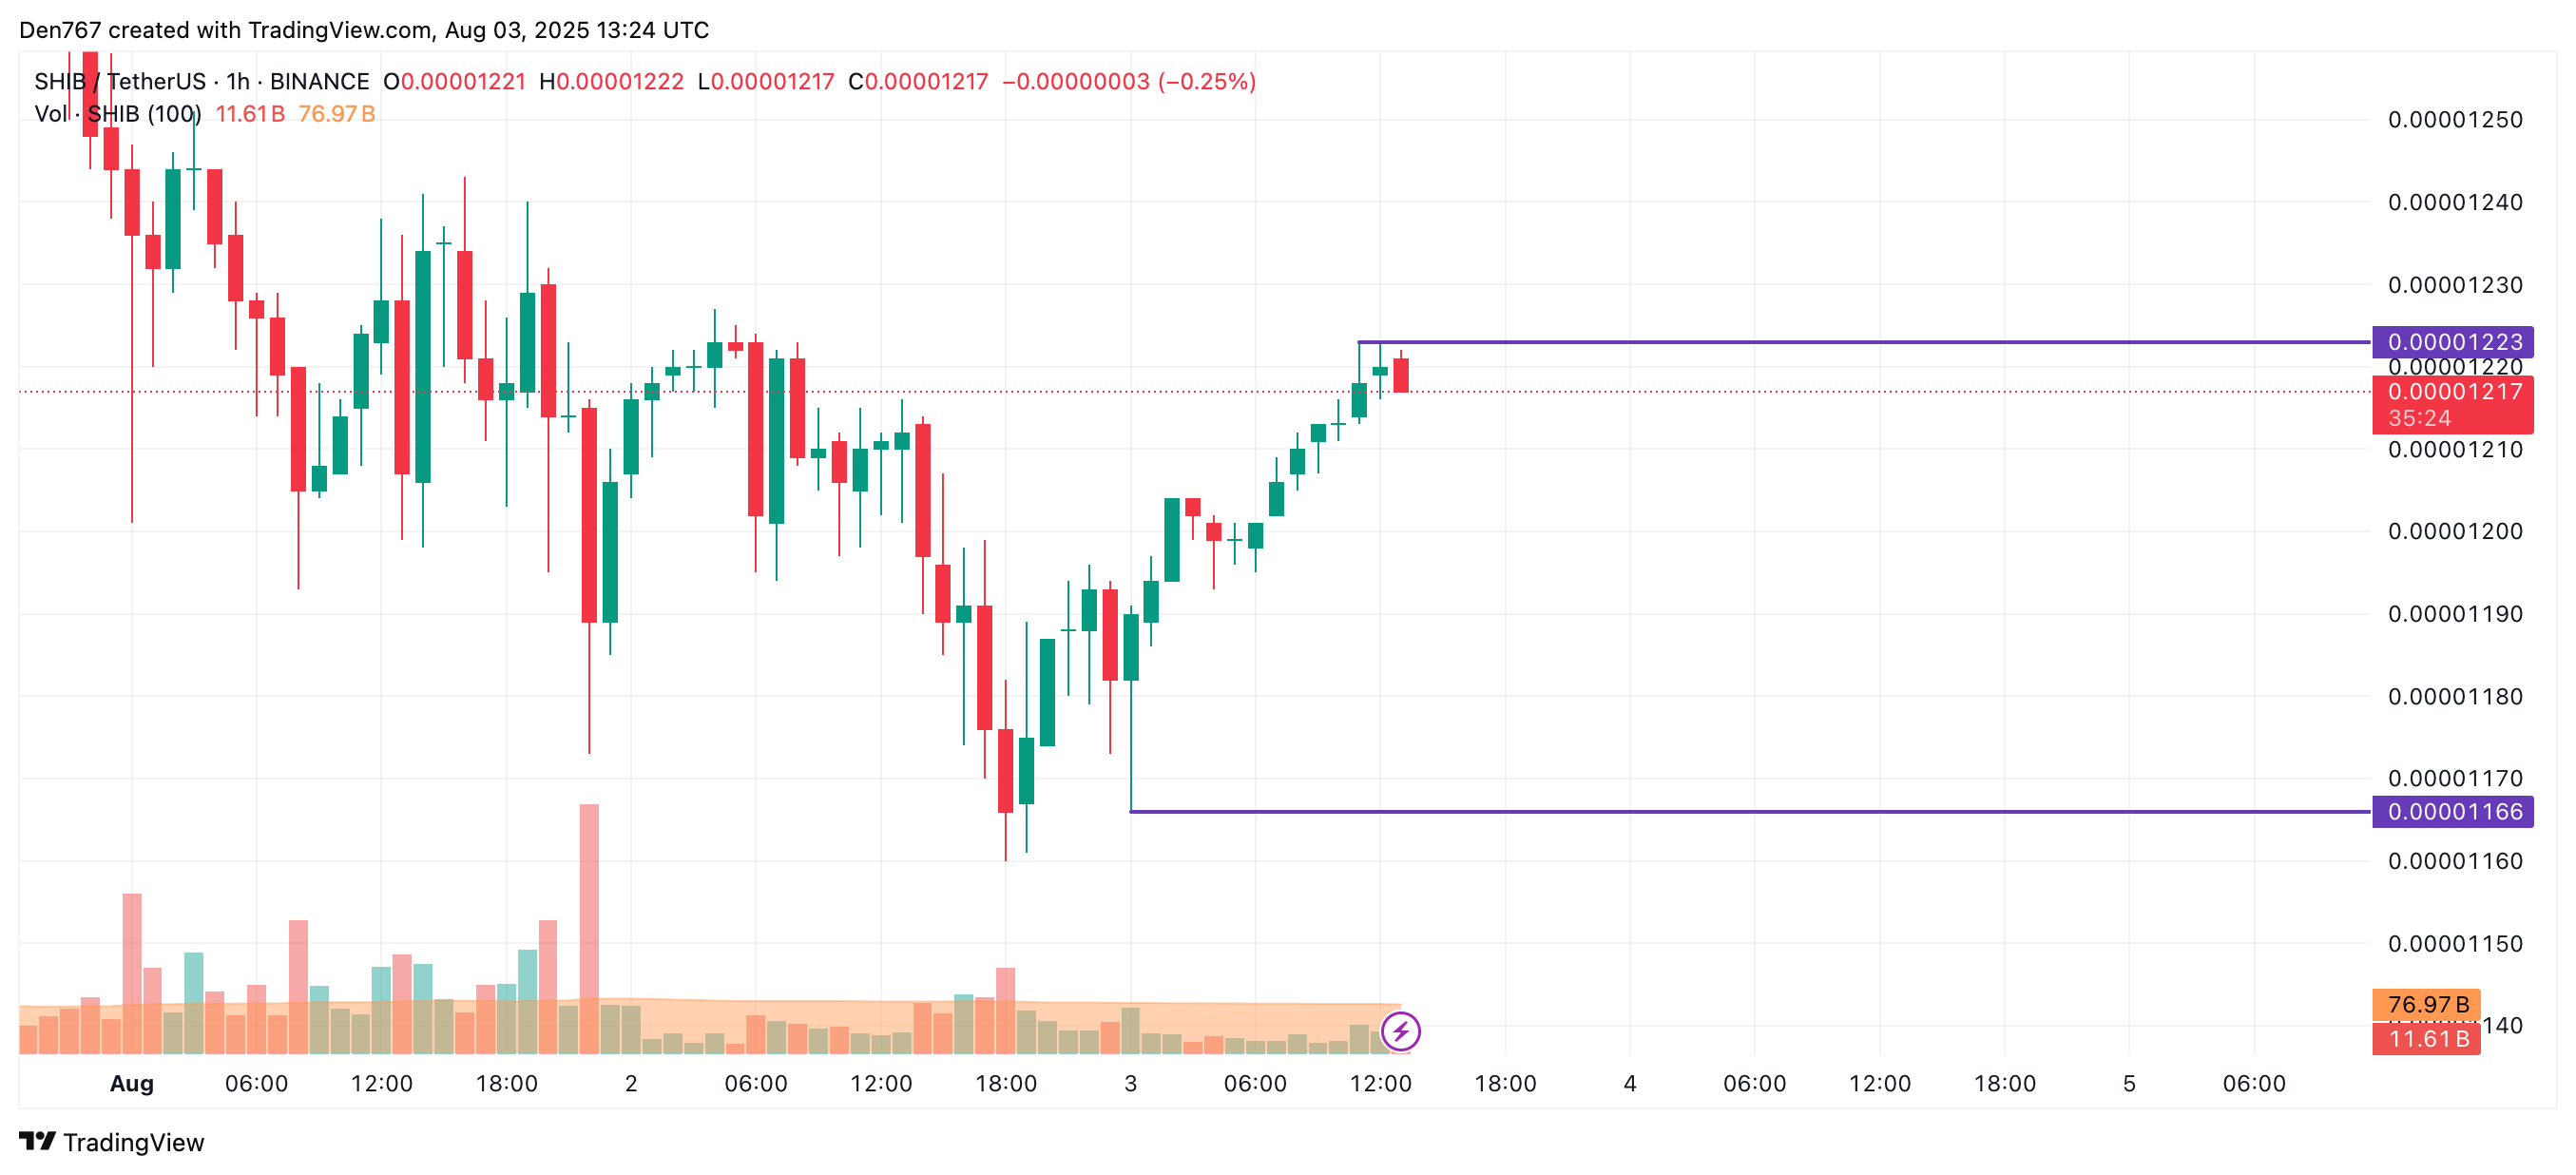
Image by TradingView
What Are the Key Technical Indicators for SHIB/USD?
Technical analysis shows that SHIB has encountered resistance at $0.00001223 on the hourly chart and $0.00001173 on higher timeframes. A daily close above $0.00001220 could trigger a move towards $0.00001250, while failure to break this level may result in a retest of $0.000010. These levels are critical for traders to watch, as they define SHIB’s short- to midterm price trajectory.
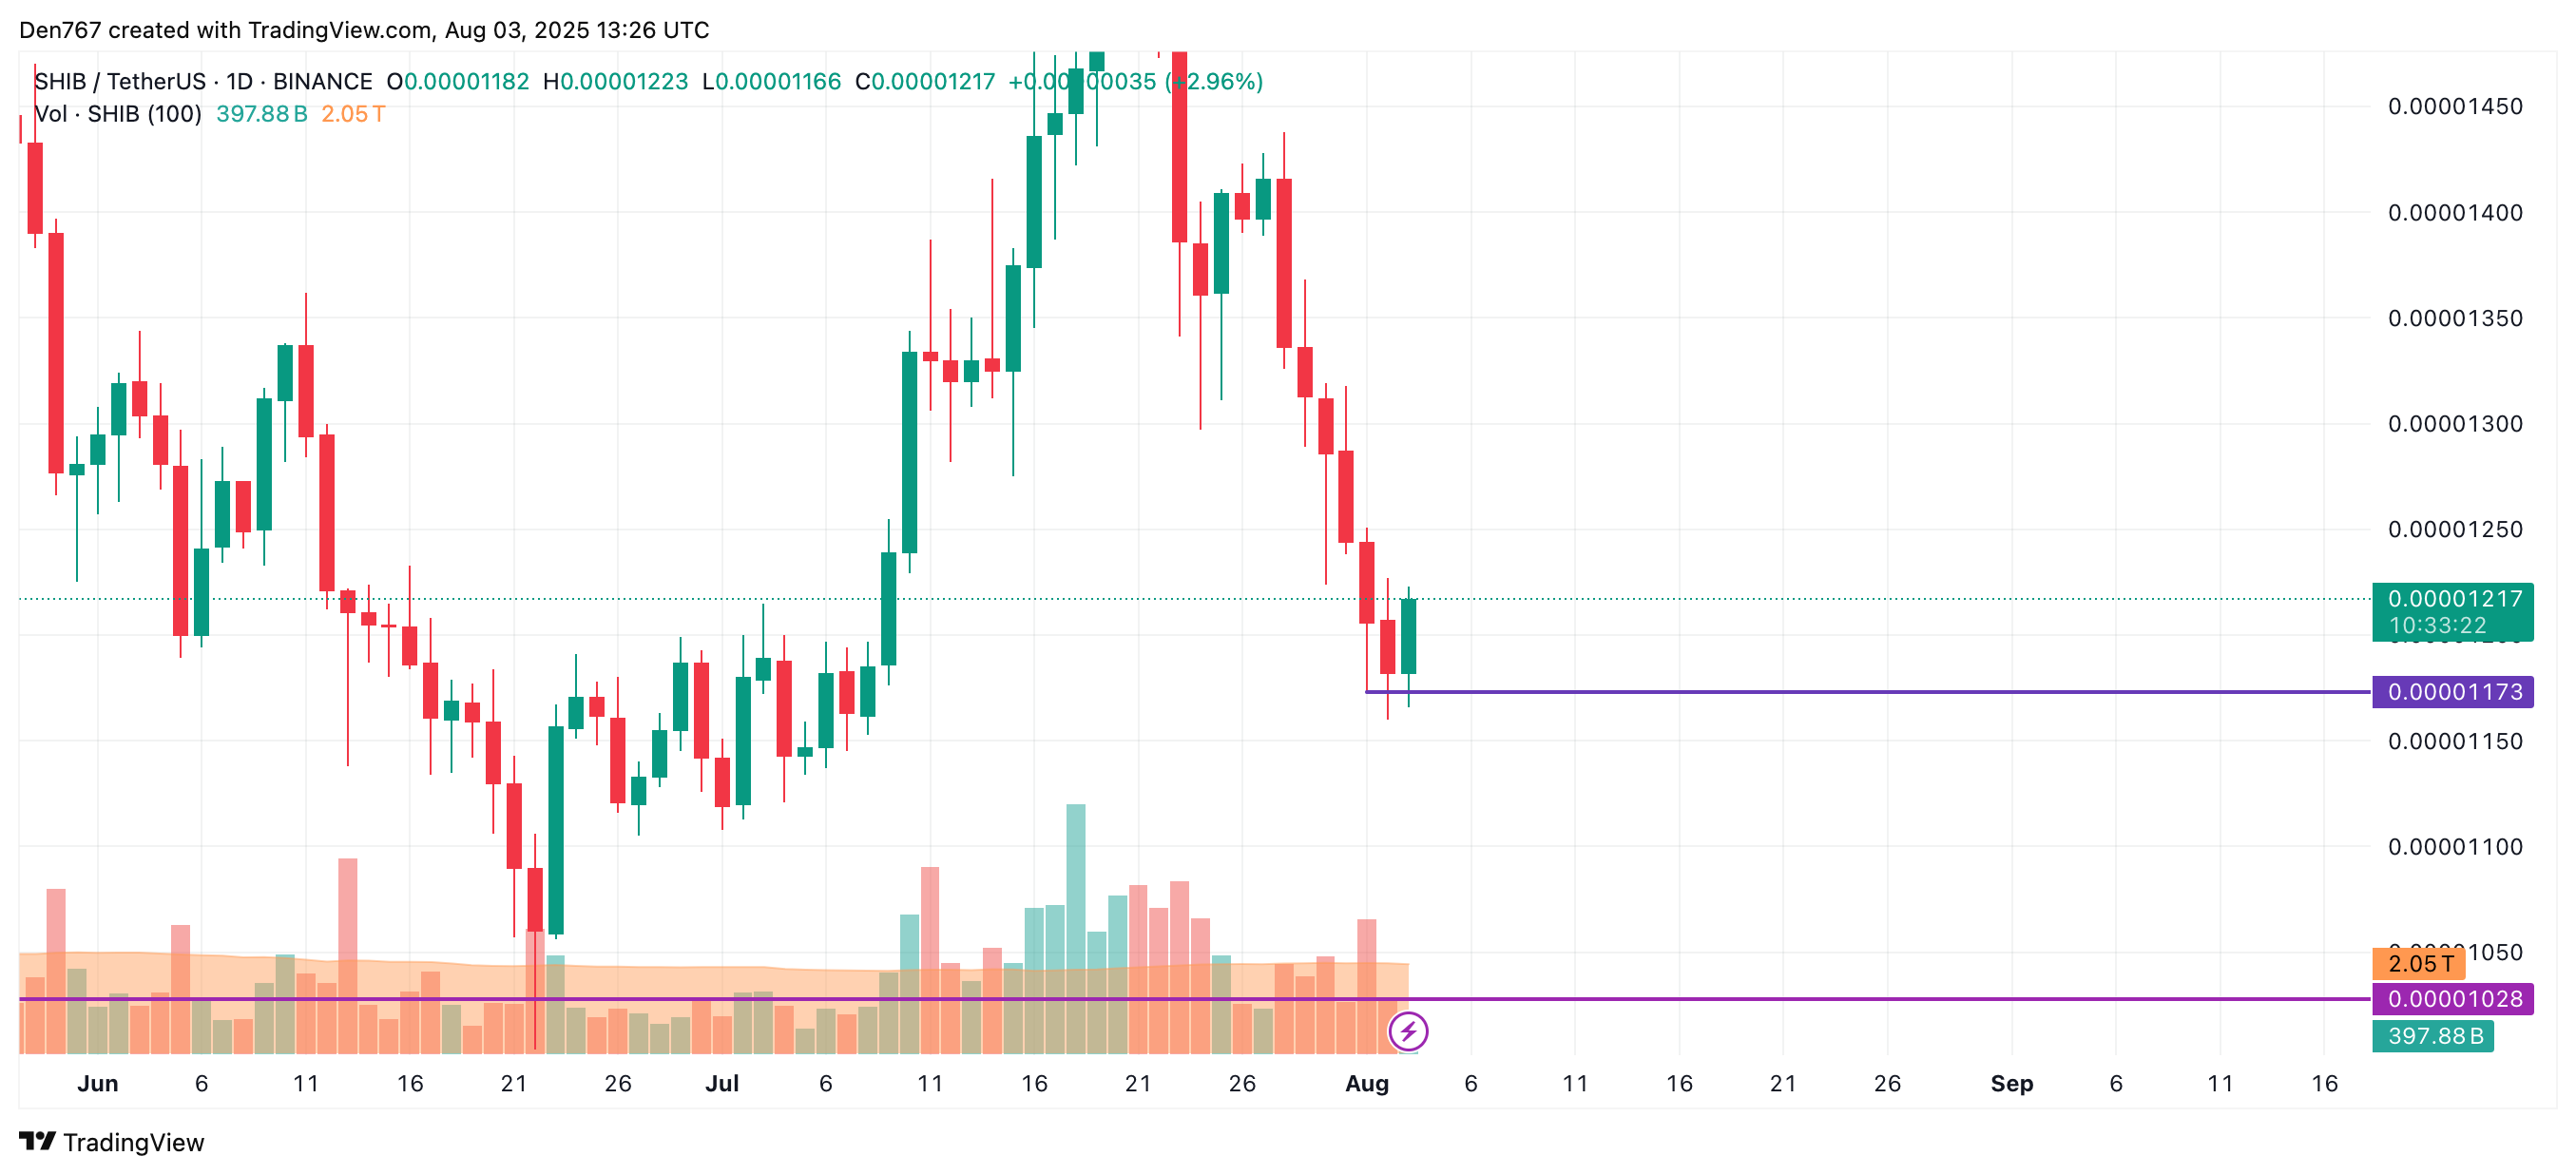
Image by TradingView
| Resistance | $0.00001220 | Breakout could lead to $0.00001250 |
| Support | $0.00001000 | Retest likely if resistance holds |
Frequently Asked Questions
What is the current price trend of SHIB/USD?
SHIB/USD is showing a slight upward trend with a 1.18% increase over the last day but faces strong resistance near $0.00001220, limiting further gains.
How can traders interpret SHIB’s recent price movements?
Traders should note the false breakout on the hourly chart and low volatility, suggesting consolidation. Watching daily closes above resistance levels is key for anticipating price direction.
How to Monitor SHIB/USD Price Movements Effectively?
To track SHIB/USD effectively, traders should:
- Monitor daily closing prices around the $0.00001220 resistance level.
- Watch for volatility changes indicated by the Average True Range (ATR).
- Use hourly charts to identify false breakouts and confirm trend reversals.
Key Takeaways
- SHIB/USD price rose 1.18% but faces strong resistance at $0.00001220.
- Low volatility limits short-term price movement, as most daily ATR is consumed.
- Daily close above resistance is crucial for potential growth toward $0.00001250.
Conclusion
The SHIB/USD pair is currently navigating key resistance levels with limited volatility, signaling a cautious market environment. Traders should focus on daily closes above $0.00001220 to confirm bullish momentum. COINOTAG will continue to provide timely updates and expert analysis to help investors make informed decisions in this evolving market.
-
SHIB/USD shows a slight daily gain amid resistance challenges, highlighting cautious market sentiment.
-
Volatility remains subdued as most daily ATR has been consumed, limiting immediate price swings.
-
COINOTAG experts emphasize the importance of daily closes above $0.00001220 for sustained upward movement.
SHIB/USD price analysis reveals resistance near $0.00001220 with low volatility; follow COINOTAG for expert crypto market insights.
SHIB/USD Price Resistance and Market Dynamics
SHIB/USD has increased by 1.18% in the past 24 hours but faces significant resistance at $0.00001220. The hourly chart indicates a false breakout at $0.00001223, suggesting sellers are defending this level. With most of the daily Average True Range (ATR) already used, the market is expected to remain calm in the near term.
Midterm Price Outlook for SHIB/USD
The midterm outlook is cautious as SHIB continues to struggle to close above $0.00001220. Failure to do so may lead to a test of support near $0.000010. COINOTAG analysis points to this level as critical for determining the next directional move.
Image by TradingView
Volatility and Trading Implications
Low volatility, indicated by the daily ATR, suggests limited price fluctuations. Traders should watch for breakouts above resistance or breakdowns below support to identify new trends. COINOTAG recommends using these levels for risk management.
Image by TradingView
Technical Indicators to Watch
Key resistance at $0.00001220 and support near $0.000010 define SHIB’s trading range. A daily close above resistance may push prices to $0.00001250, while failure to break resistance could lead to a retest of support.
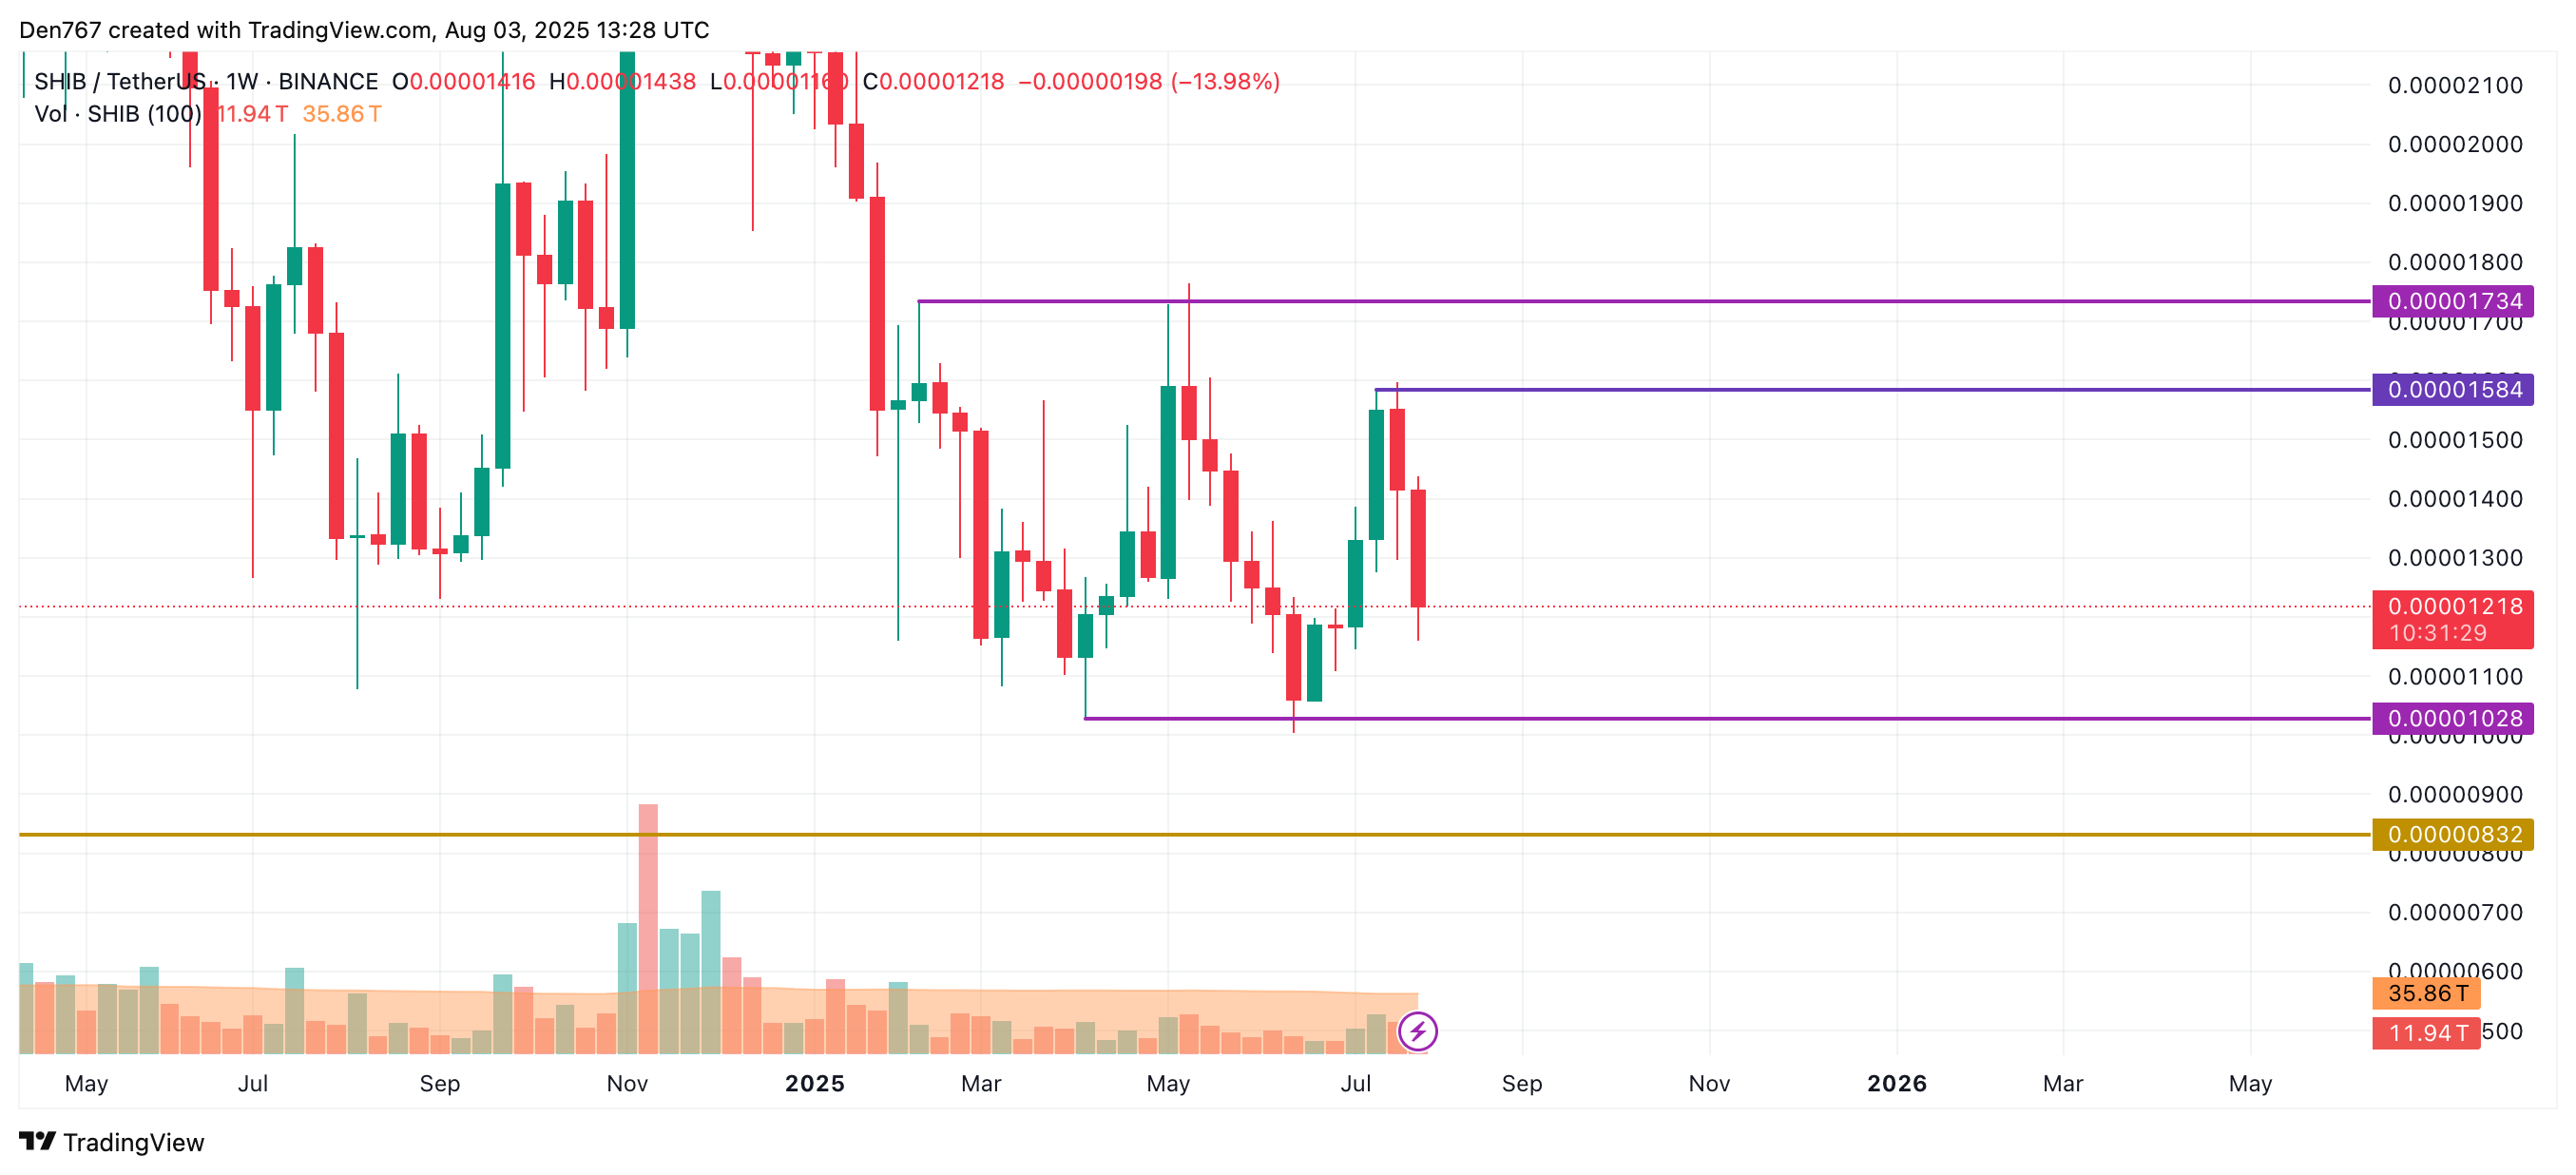
Image by TradingView


