Stellar (XLM) Risks a 40% Drop as Bearish Divergence Returns

XLM price sits around $0.47 after a 103% run. Bearish RSI divergence and a liquidation cluster below $0.40 raise deeper correction risk. Fibonacci supports at $0.44, $0.40, and $0.33 mark the path lower, while a close above $0.52 would negate the bearish view.
Stellar’s (XLM) price trades near $0.47 after a 103% month-on-month. The rally has stalled into small daily candles (mostly indecisive Doji candles).
And two daily signals now lean lower: a heavy block of leveraged longs sits under price, and slipping momentum. Key support levels might be at risk.
Leverage Pocket Below $0.40 Raises Cascade Risk
Price is hovering above $0.45, but Bitget’s 30‑day XLM/USDT liquidation map shows roughly $79.8 million of long exposure compared with about $42.1 million in shorts, with the cumulative cluster highlighted under $0.40.
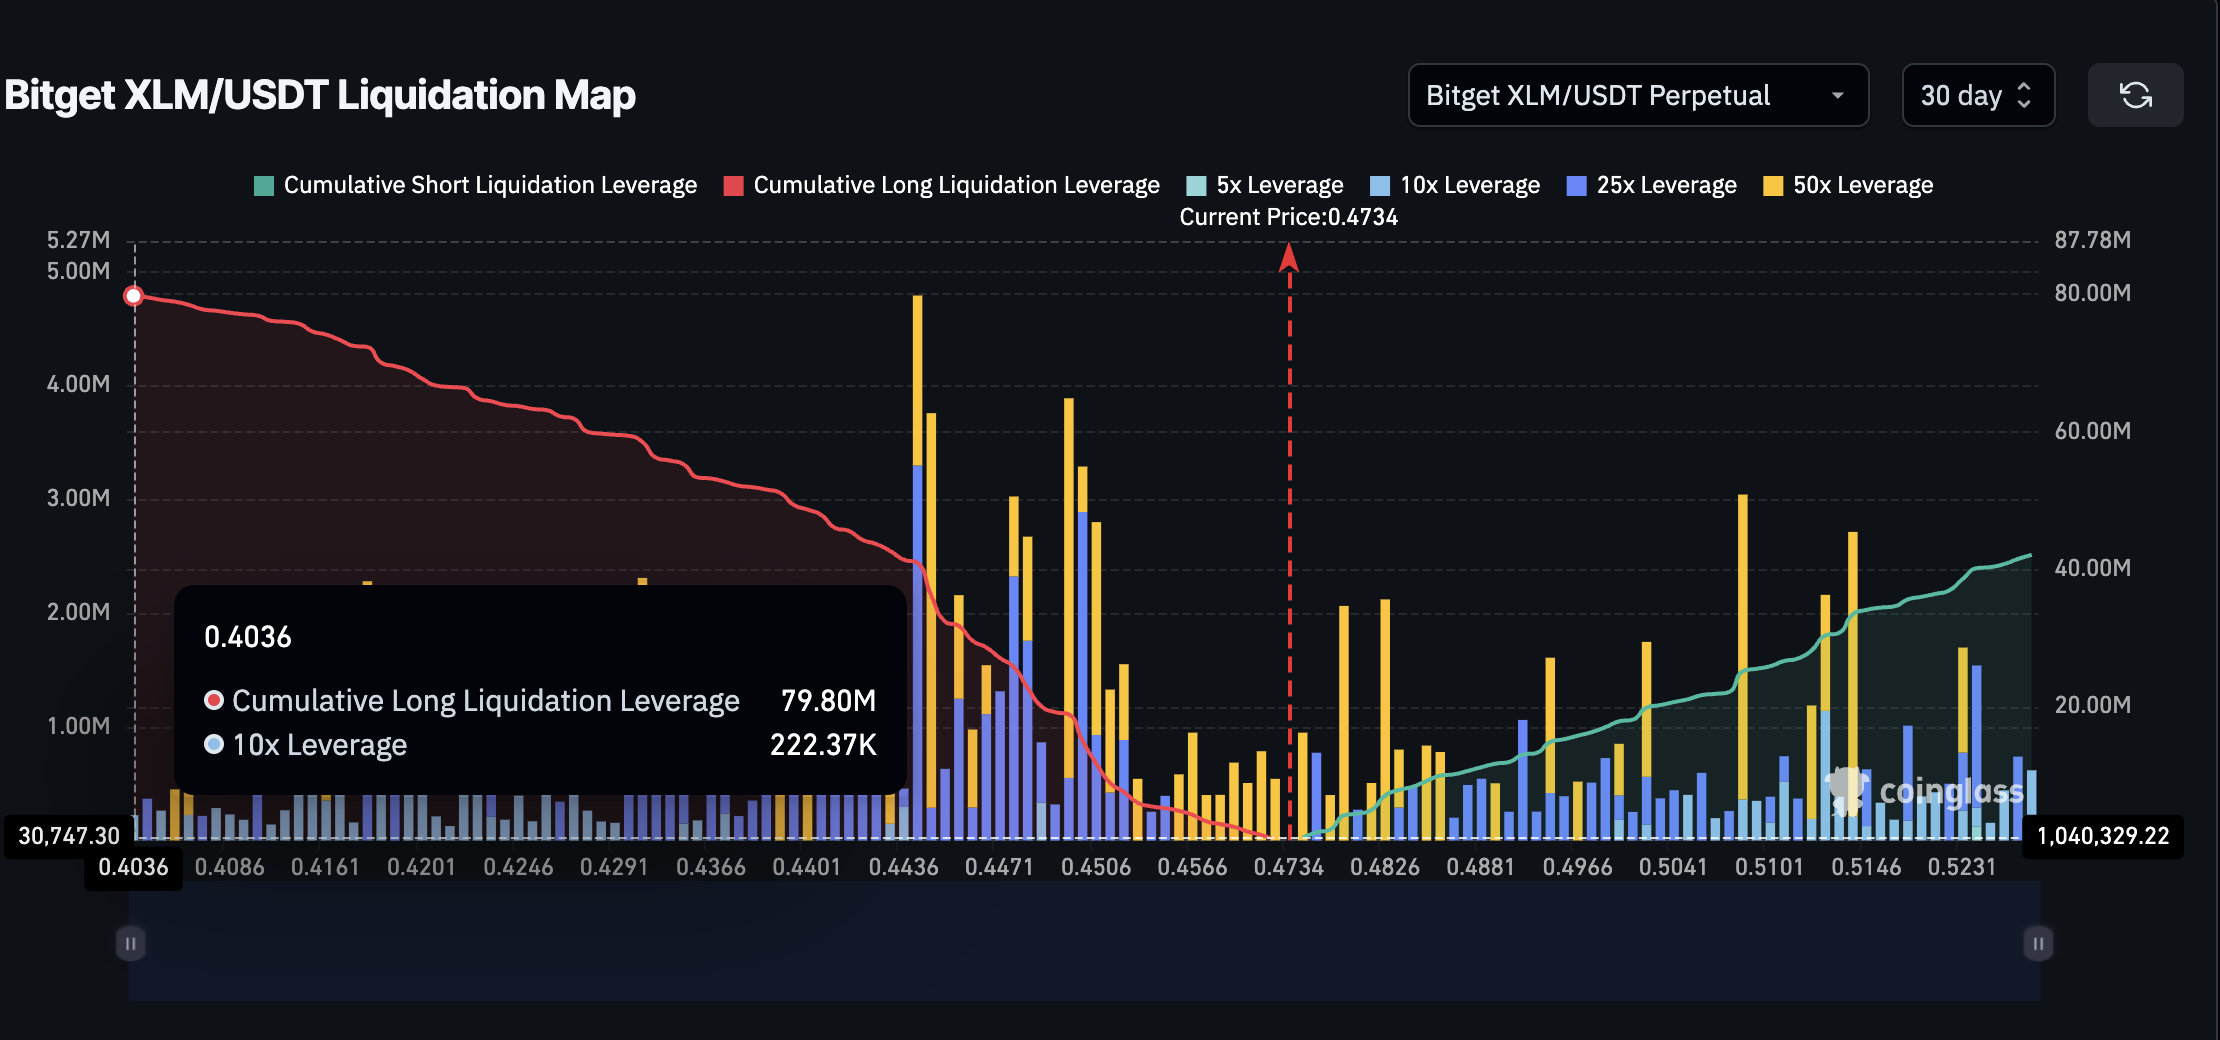 XLM price and key liquidation cluster (Bitget):
Each step down would trigger smaller pockets first, then the dense area under $0.40 can amplify selling as forced closures hit the order book.
A liquidation map plots where leveraged positions get auto-closed; when the largest clusters sit below spot, even a modest drop can snowball.
Daily RSI Divergence Mirrors December Slide
Since July 14, the price has held near the highs while the Relative Strength Index (RSI) on the daily chart has made lower highs.
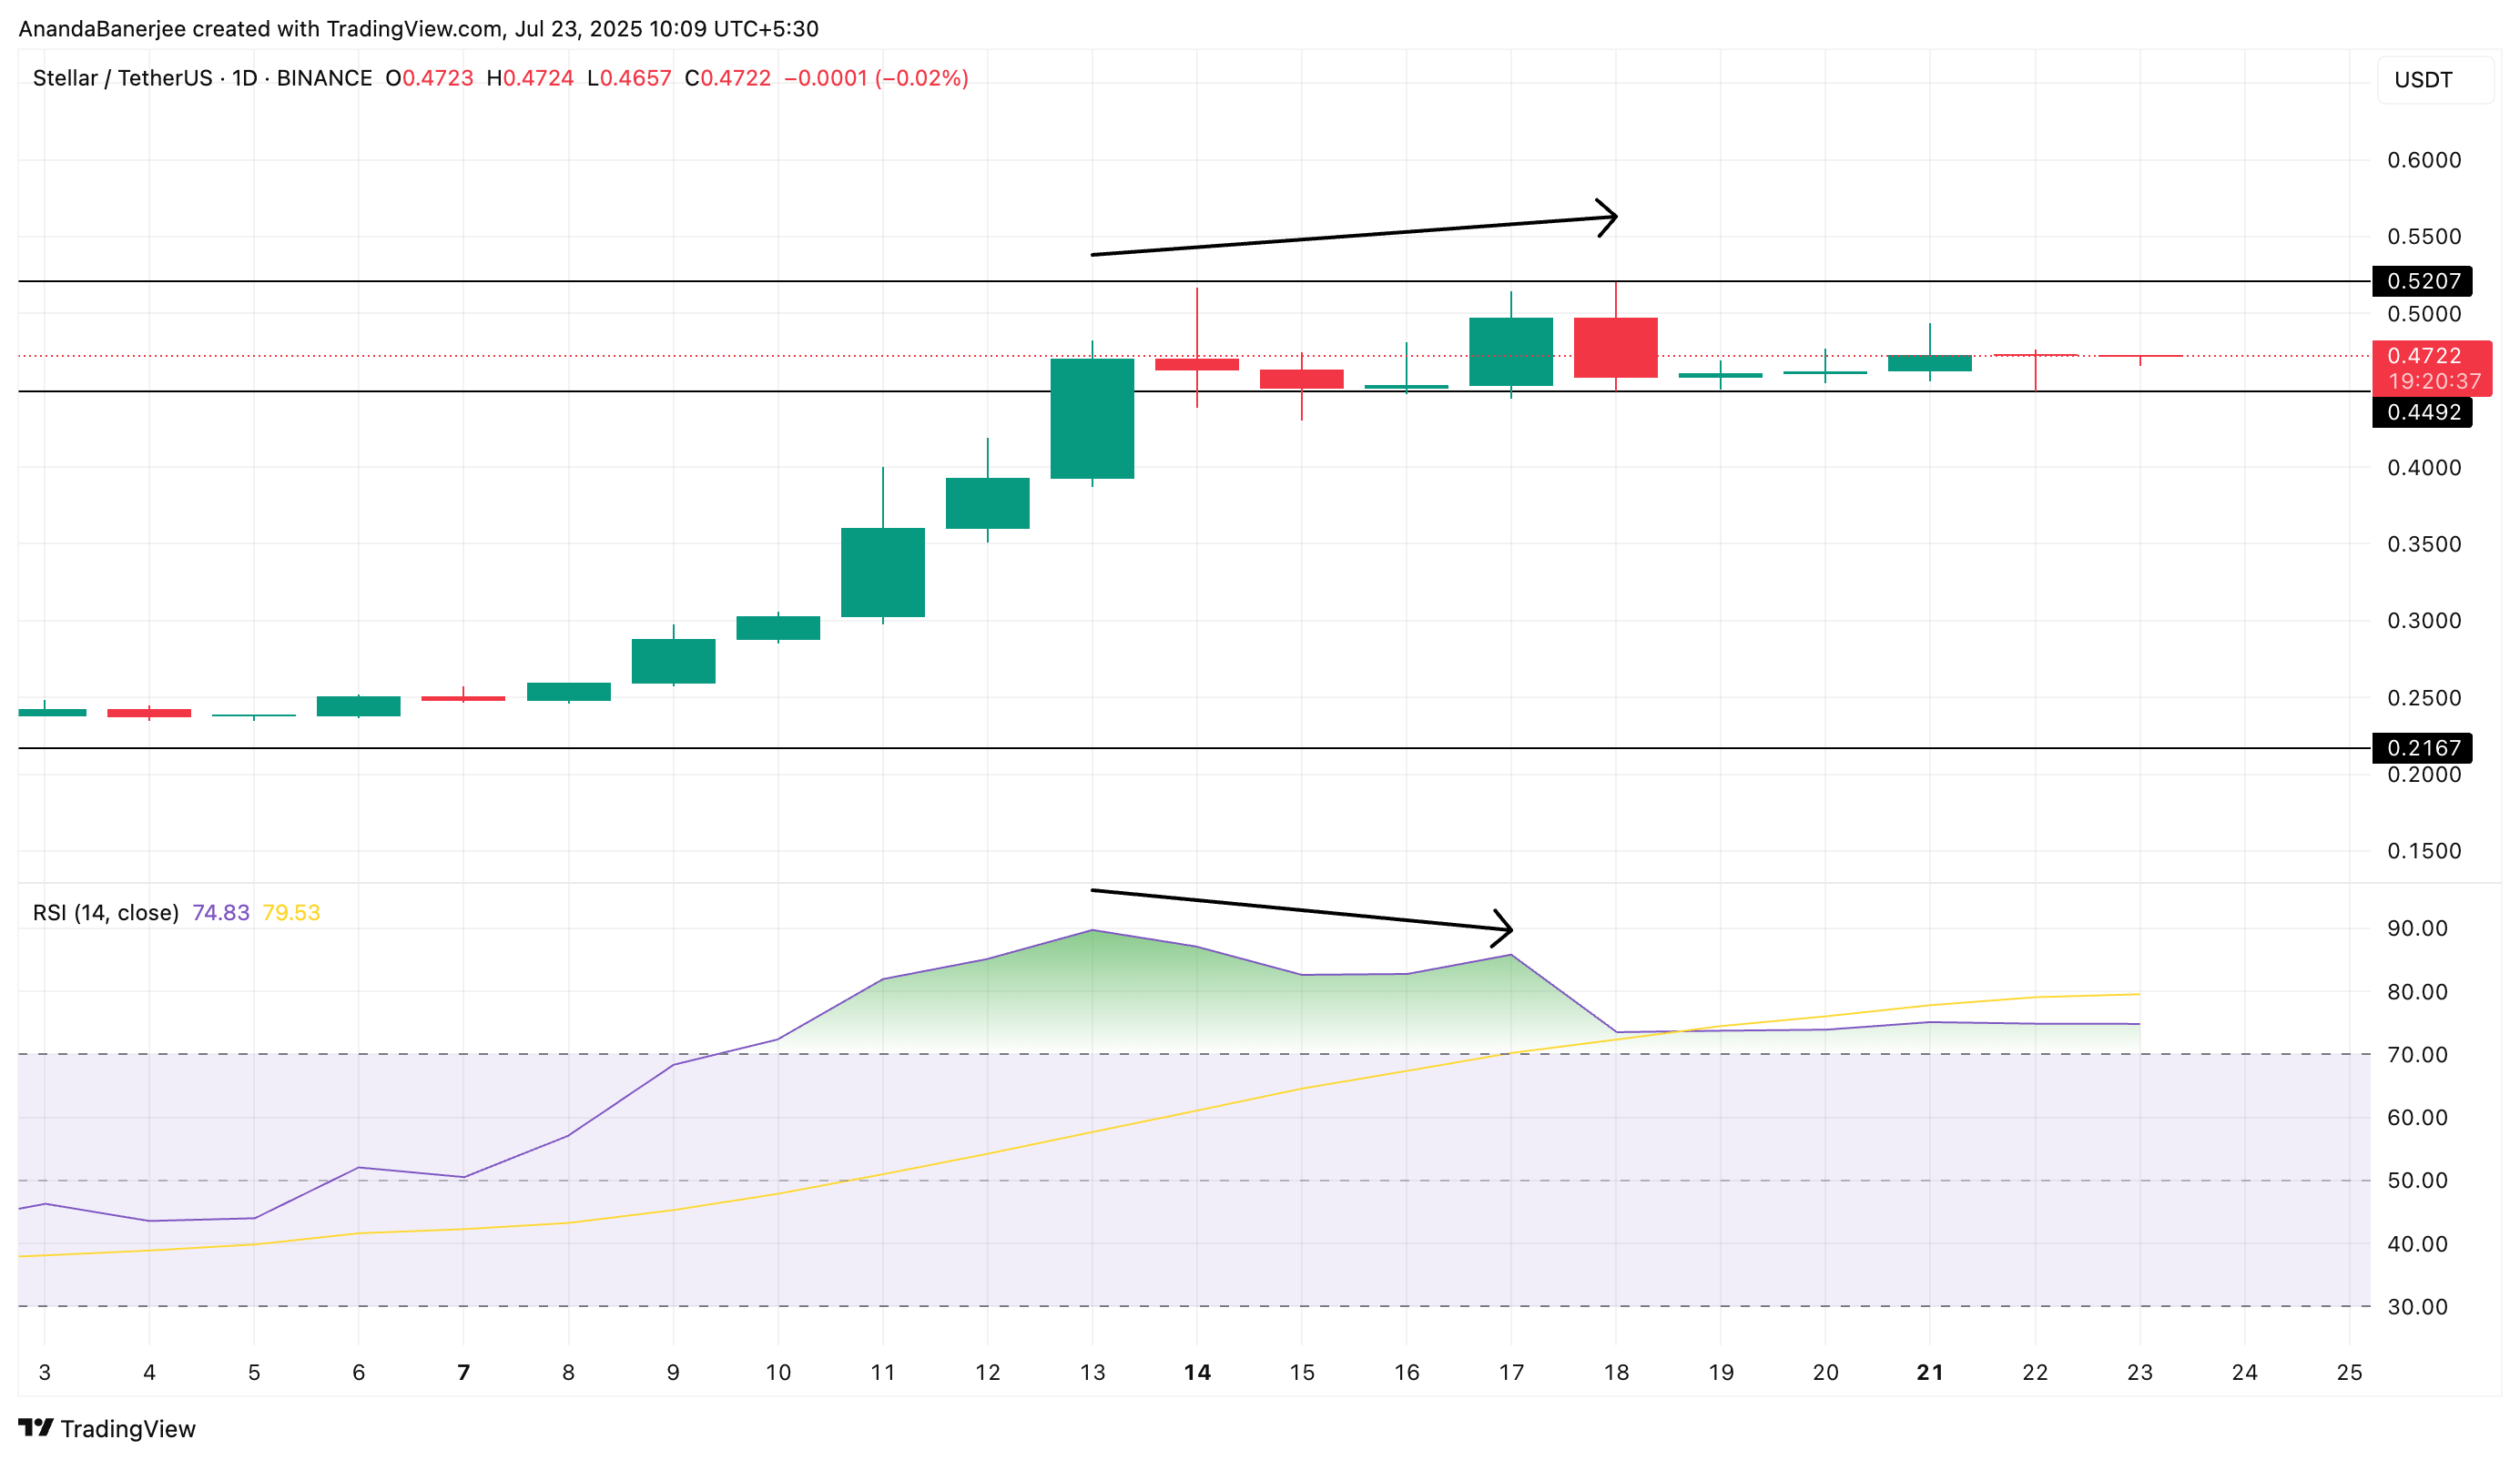 Stellar price and RSI divergence:
The last time XLM showed this pattern, in late December, the price fell over 40%.
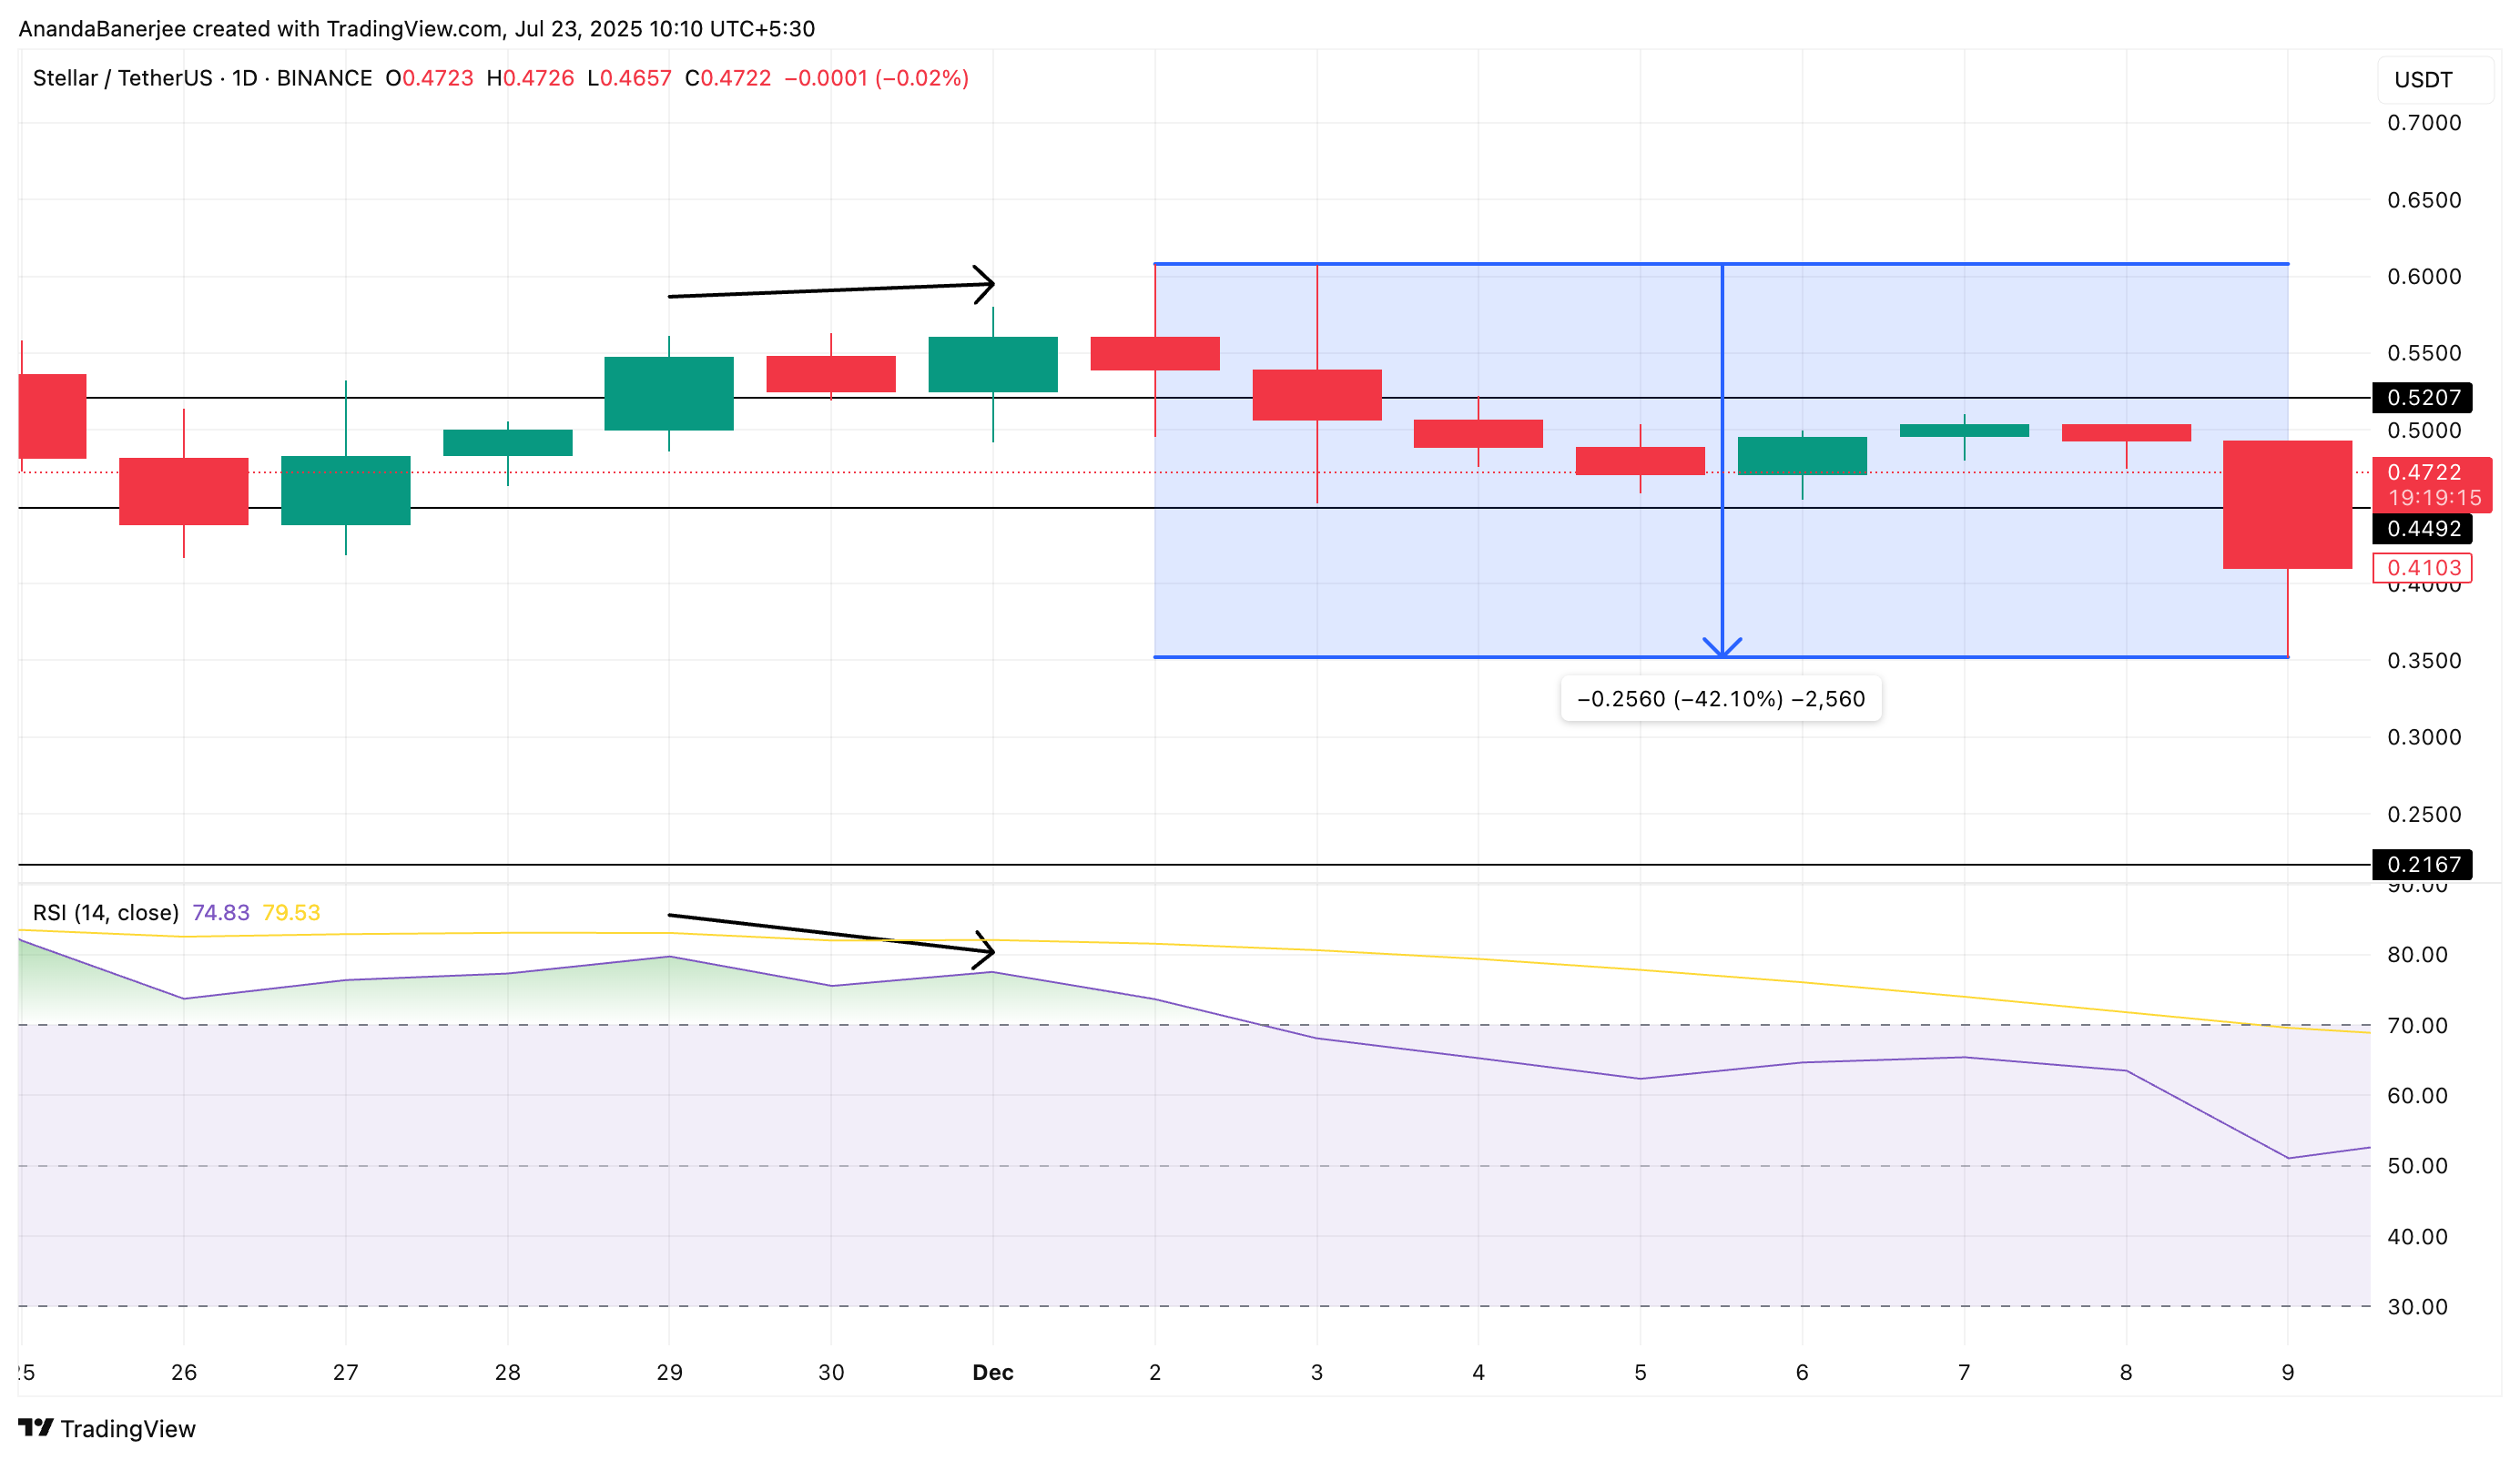 RSI divergence pattern from December 2024:
RSI measures the strength of recent price movements on a 0–100 scale. When price is steady or rising but RSI eases, momentum is not confirming the move, and pullback risk increases.
With leverage and liquidation risks waiting below, that loss of momentum becomes more dangerous, supporting the “XLM price correction” logic.
Want more token insights like this? Sign up for Editor Harsh Notariya’s Daily Crypto Newsletter
XLM Price Now Eyes Key Support Levels
A Fibonacci retracement drawn from the $0.21 low to the $0.52 high frames the likely supports if selling starts: $0.44 (0.236) being the strongest level will multiple support hits.
Fibonacci levels mark common pullback areas, and when they overlap with liquidation clusters, reactions tend to be sharper.
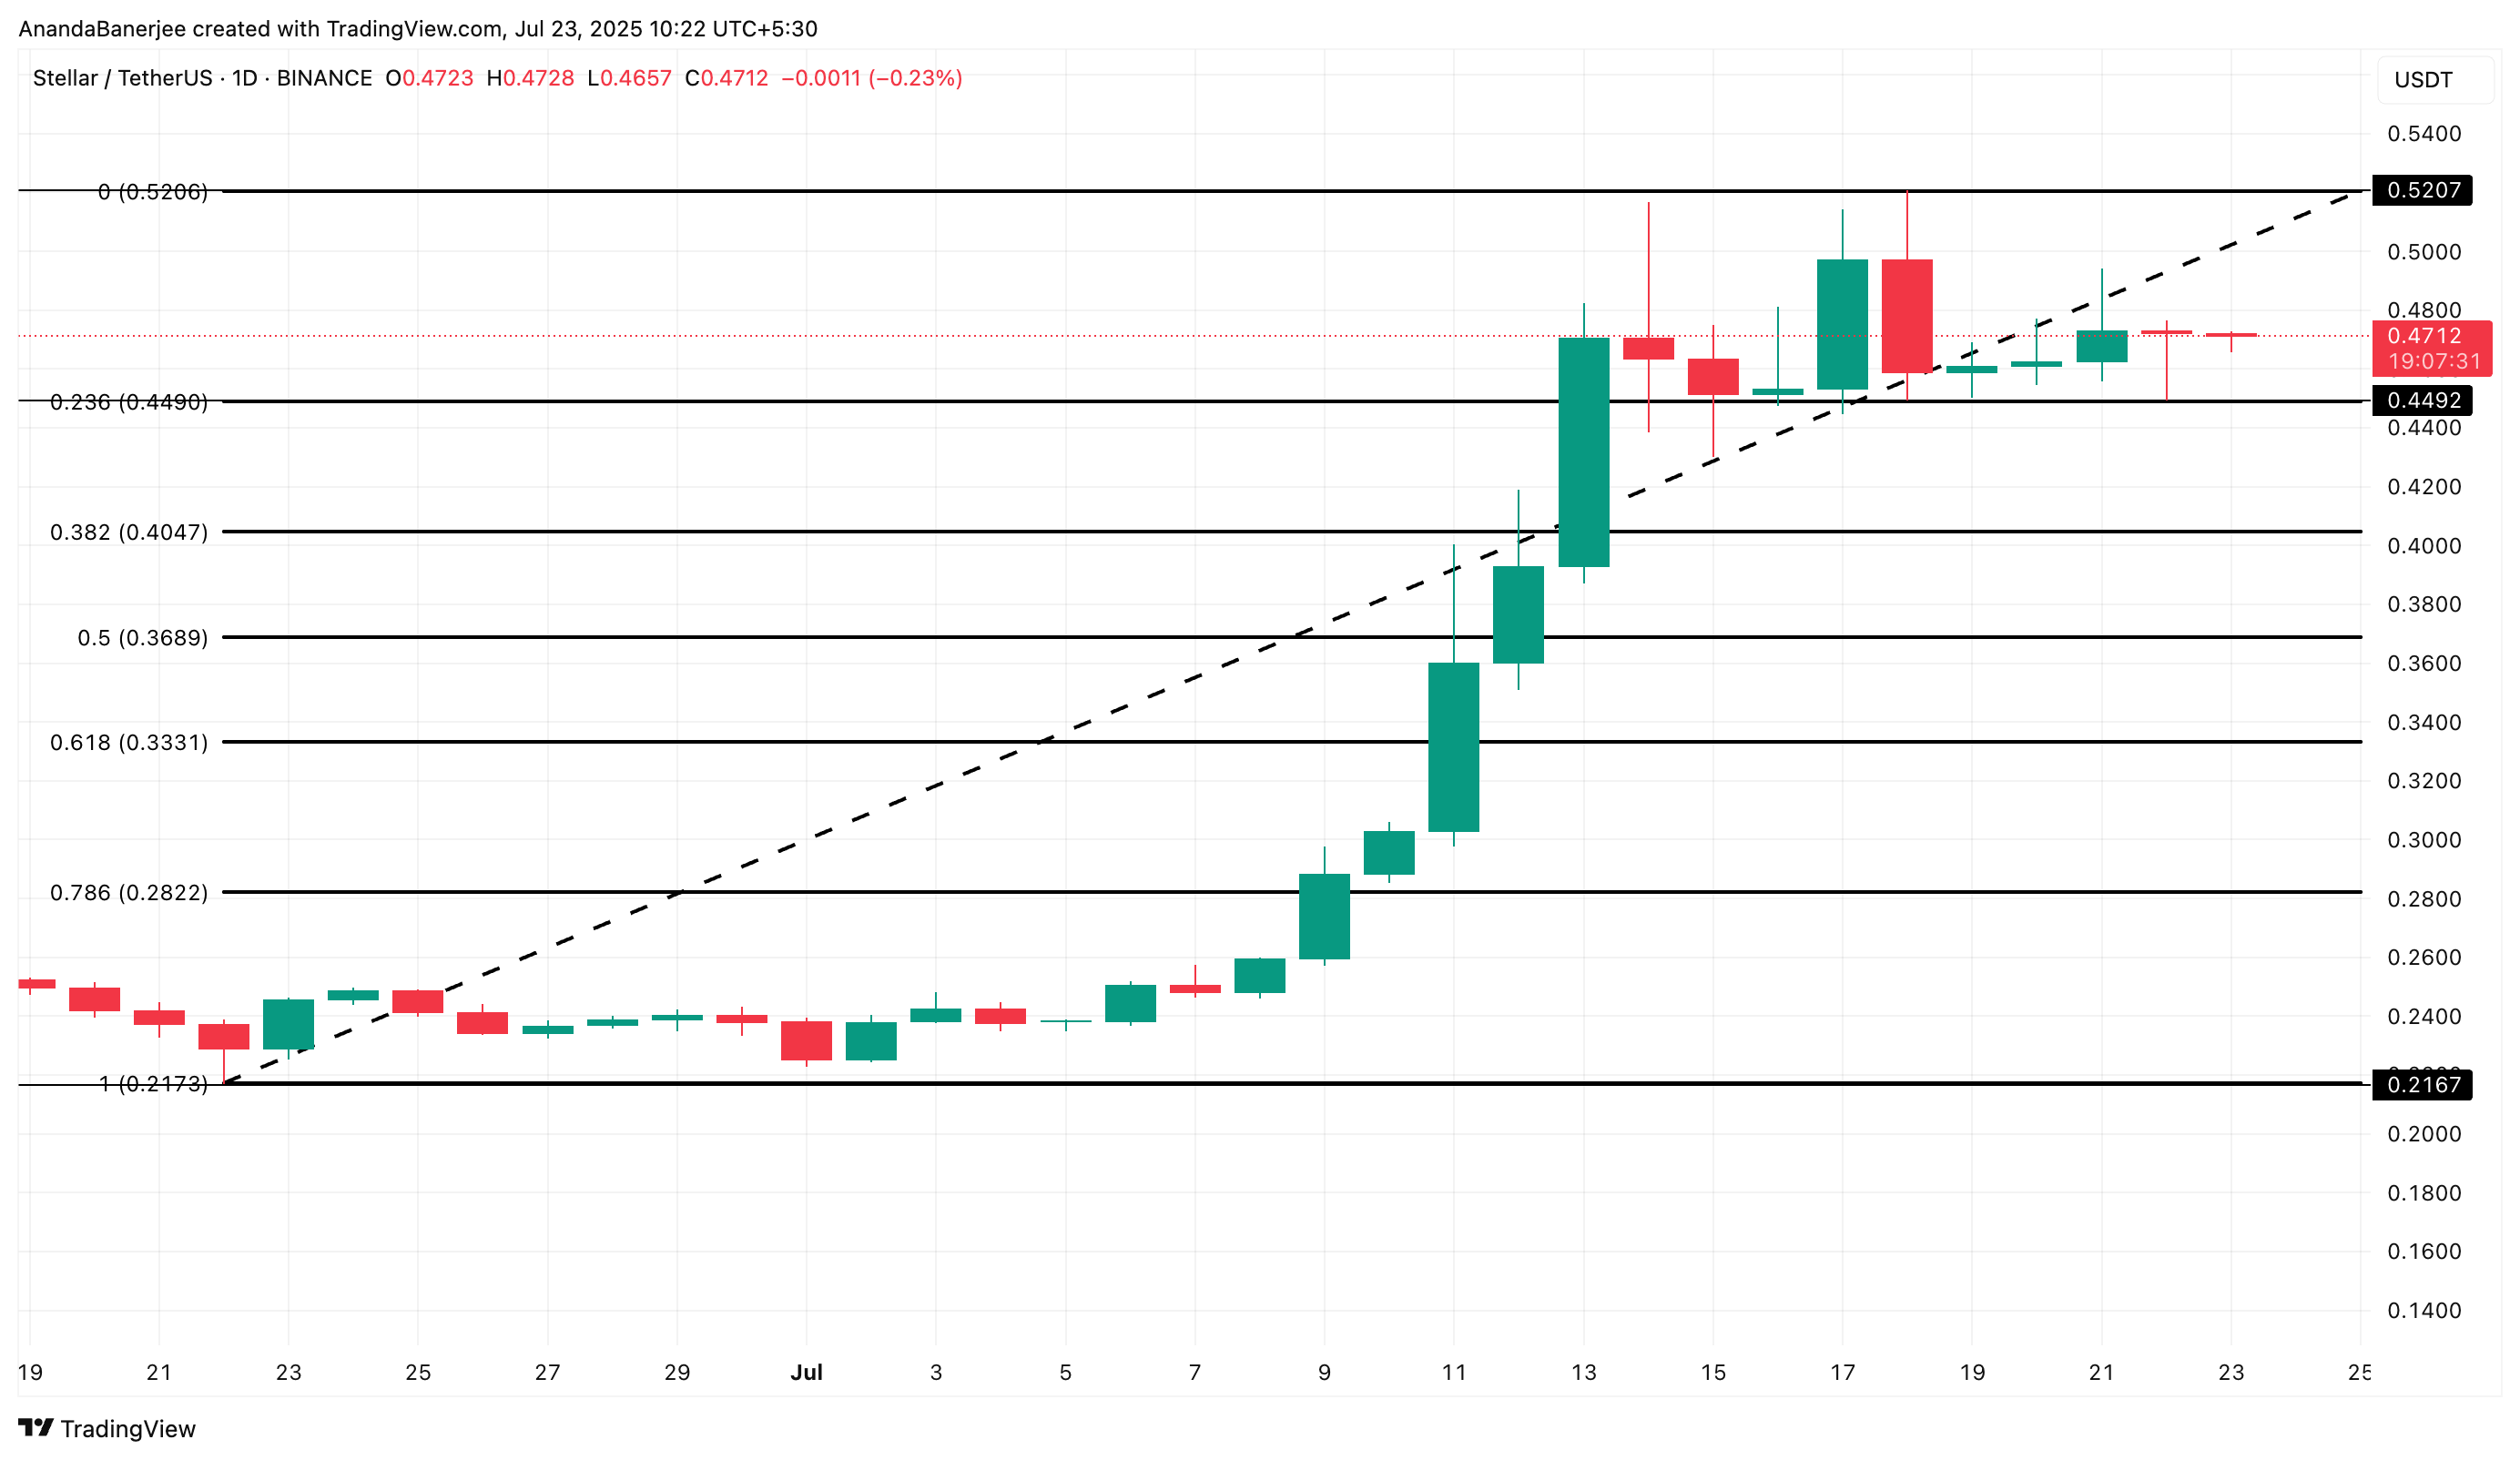 XLM price analysis:
XLM is currently sitting above $0.44. A daily close beneath that level would put $0.40 in focus. Below $0.40, the liquidation hypothesis wins, so a break there could speed a move toward $0.33. A 40% decline (inspired by the December 2024 pattern) from the $0.52 high lands under $0.33.
Under $0.28 (if the $0.33 level breaks), the entire XLM price structure could turn bearish in the short term.
Invalidation is straightforward: a firm daily close back above $0.52, with RSI turning up and liquidation risk thinning out, would neutralize this bearish setup and restore the upside case.
Disclaimer: The content of this article solely reflects the author's opinion and does not represent the platform in any capacity. This article is not intended to serve as a reference for making investment decisions.
You may also like
How much is ETH really worth? Hashed provides 10 different valuation methods in one go
After taking a weighted average, the fair price of ETH exceeds $4,700.

Dragonfly partner: Crypto has fallen into financial cynicism, and those valuing public blockchains with PE ratios have already lost
People tend to overestimate what can happen in two years, but underestimate what can happen in ten years.

Balancer Rallies to Recover and Redistribute Stolen Funds After Major Cyber Attack
In Brief Balancer plans to redistribute $8 million to users after a massive cyber theft. The recovery involved crucial roles by white-hat researchers rewarded with 10% incentives. Unclaimed funds will undergo governance voting after 180 days.

Bitcoin Faces Renewed Selling Pressure as Whale Deposits Spike and Market Fear Deepens