
Bitcoin ( BTC ) saw continued weakness into Feb. 23 as consolidation accompanied a brief slowdown in institutional investment.
Bitget App
Trade smarter

Bitcoin ETF inflows recover as BTC price nears key $50K support
By:William Suberg
Bitcoin ETFs bounce back from day of outflows
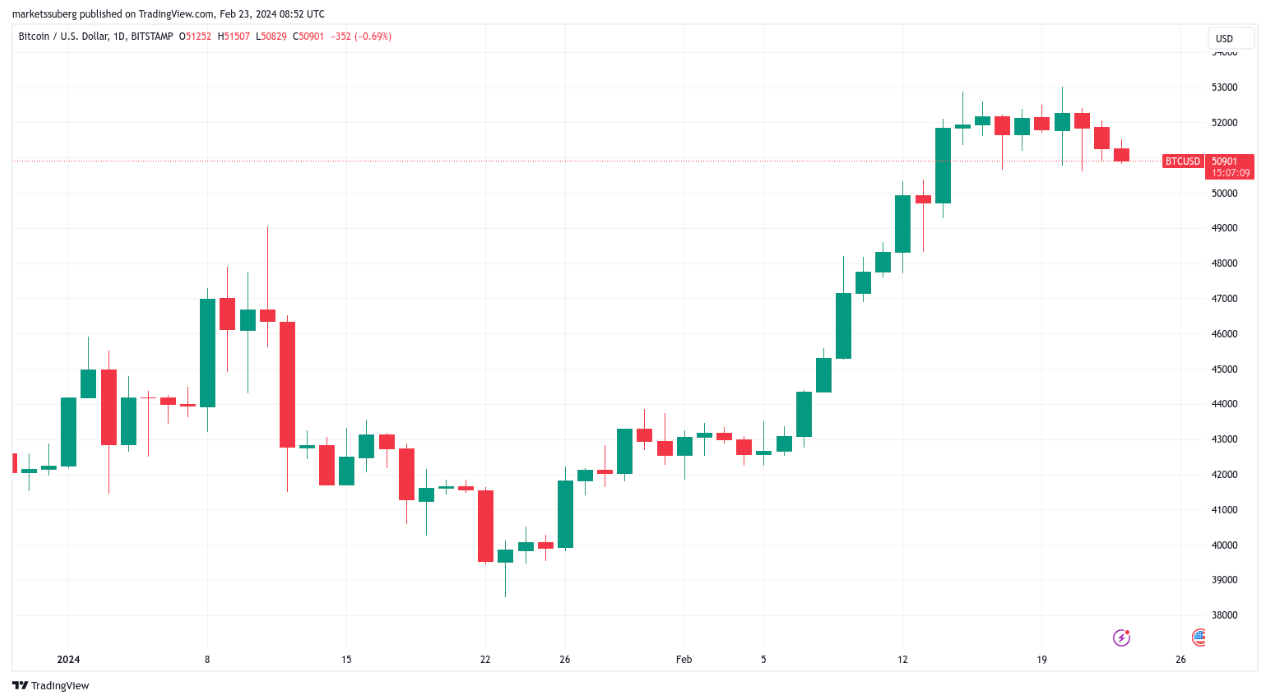
Data from Cointelegraph markets Pro and TradingView showed BTC price action struggling around $51,000.
Bulls remained caught in a narrow trading zone , in place for more than a week, as concerns surfaced over inflows to the spot Bitcoin exchange-traded funds (ETFs).
These slowed considerably in recent days, with Feb. 21 even seeing a net outflow of some $36 million, per data uploaded to X (formerly Twitter) by sources including BitMEX Research.
Same data in BTC terms.
— BitMEX Research (@BitMEXResearch) February 22, 2024
694 BTC net outflow on 21 Feb 2024 pic.twitter.com/mpqoo44VA2
Feb. 22 saw stronger activity — net inflows of just over a quarter of a million dollars, even accounting for outflows from the Grayscale Bitcoin Trust (GBTC).
“Normality resumed a $251M inflow into the Bitcoin ETFs,” James Van Straten, research and data analyst at crypto insights firm CryptoSlate, responded .
Continuing on the pace of buying from the ETF operators, Thomas Fahrer, CEO of crypto-focused reviews portal Apollo, predicted that the largest of them, BlackRock’s iShares Bitcoin ETF (IBIT), would in future change BTC supply dynamics.
“98% of all the #Bitcoin in existence already costs >100K if you tried to buy it,” he argued alongside a chart of IBIT holdings.
“Remember that the current price is just the marginal trade. Blackrock is going to test this theory, so we'll find out soon enough.”
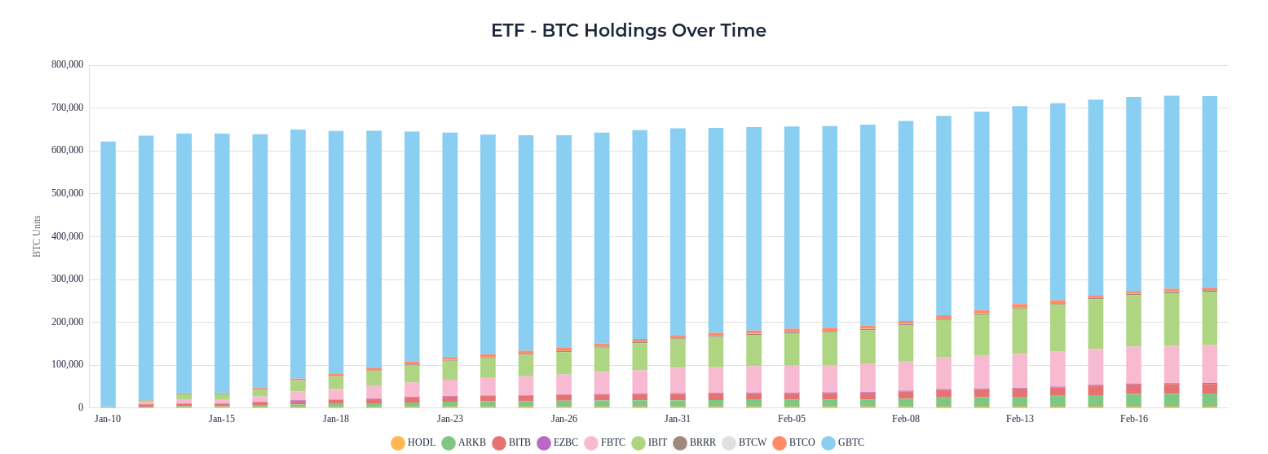
Spot Bitcoin ETF holdings (screenshot). Source: Apollo
As of Feb. 23, IBIT held 124,535 BTC ($6.35 billion), per data from Apollo’s own ETF tracker .
BTC price nears "trend inflection point"
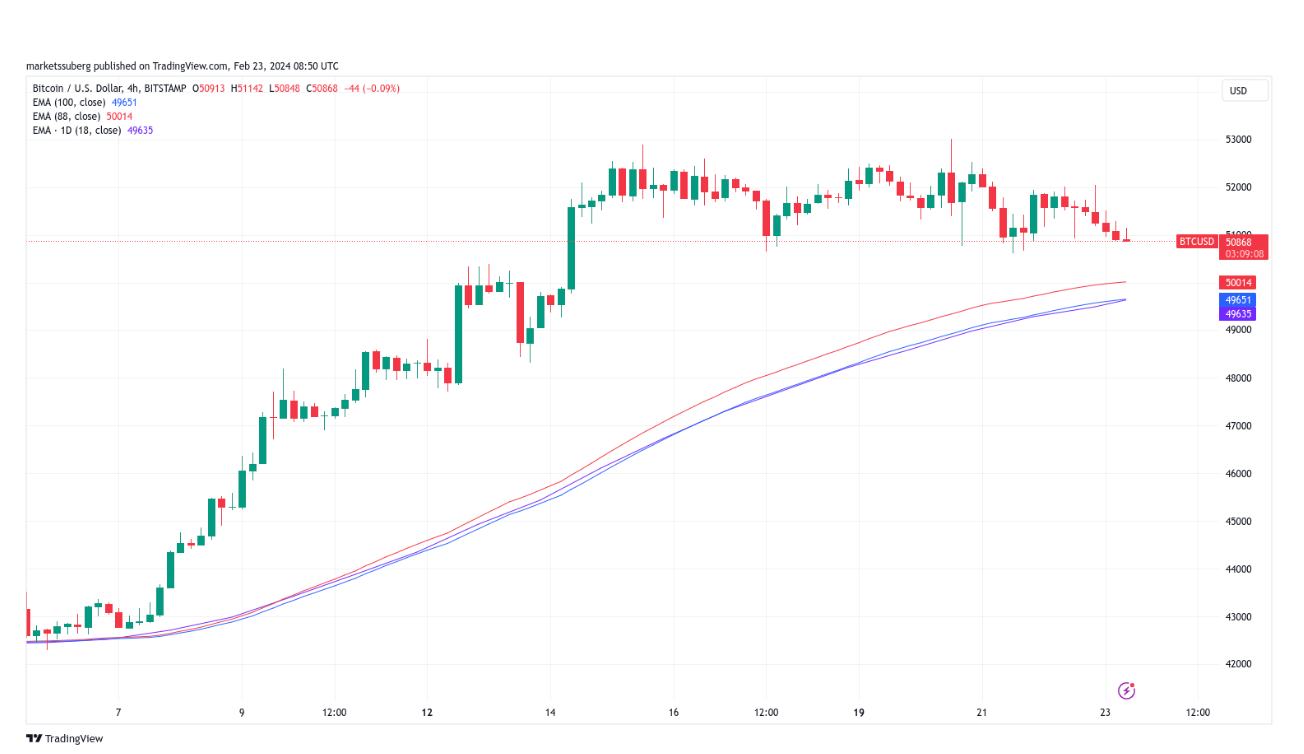
Focusing on low-timeframe BTC price analysis, meanwhile, popular trader Skew captured the mood among seasoned market observers.
The uptrend, he concluded, remained intact, but important support levels were now coming back into play.
These were the 88-period and 100-period exponential moving averages (EMAs) on the 4-hour chart at $50,017 and $49,654, respectively, along with the 18-period EMA on the daily chart at $49,645.
“Currently price trades around range low 4H 55EMA which typically is a near term trend inflection point, meaning momentum picks up soon,” part of his latest X analysis read.
“Buyers Sellers likely to fight here for control.”
This article does not contain investment advice or recommendations. Every investment and trading move involves risk, and readers should conduct their own research when making a decision.
2
0
Disclaimer: The content of this article solely reflects the author's opinion and does not represent the platform in any capacity. This article is not intended to serve as a reference for making investment decisions.
PoolX: Earn new token airdrops
Lock your assets and earn 10%+ APR
Lock now!
You may also like
Interview with VanEck Investment Manager: From an Institutional Perspective, Should You Buy BTC Now?
The support levels near $78,000 and $70,000 present a good entry opportunity.
深潮•2025/11/28 07:23

Macroeconomic Report: How Trump, the Federal Reserve, and Trade Sparked the Biggest Market Volatility in History
The deliberate devaluation of the US dollar, combined with extreme cross-border imbalances and excessive valuations, is brewing a volatility event.
深潮•2025/11/28 07:22
Vitalik donated 256 ETH to two chat apps you've never heard of—what exactly is he betting on?
He made it clear: neither of these two applications is perfect, and there is still a long way to go to achieve true user experience and security.
深潮•2025/11/28 07:22
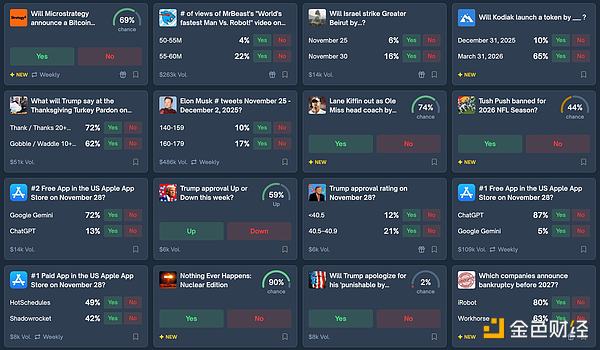
Prediction Market Supercycle
金色财经•2025/11/28 07:15
Trending news
MoreCrypto prices
MoreBitcoin
BTC
$91,449.02
+0.04%
Ethereum
ETH
$3,019.33
-0.42%
Tether USDt
USDT
$0.9999
-0.04%
XRP
XRP
$2.21
-0.19%
BNB
BNB
$889.32
-0.44%
Solana
SOL
$139.93
-2.81%
USDC
USDC
$0.9997
-0.03%
TRON
TRX
$0.2810
+1.55%
Dogecoin
DOGE
$0.1504
-2.58%
Cardano
ADA
$0.4268
-1.74%
How to buy BTC
Bitget lists BTC – Buy or sell BTC quickly on Bitget!
Trade now
Become a trader now?A welcome pack worth 6200 USDT for new users!
Sign up now