Crypto Price Today: Bitcoin, Ethereum, Dogecoin, and Solana at Key Levels
Crypto Market Holding Key Structure After Pullback
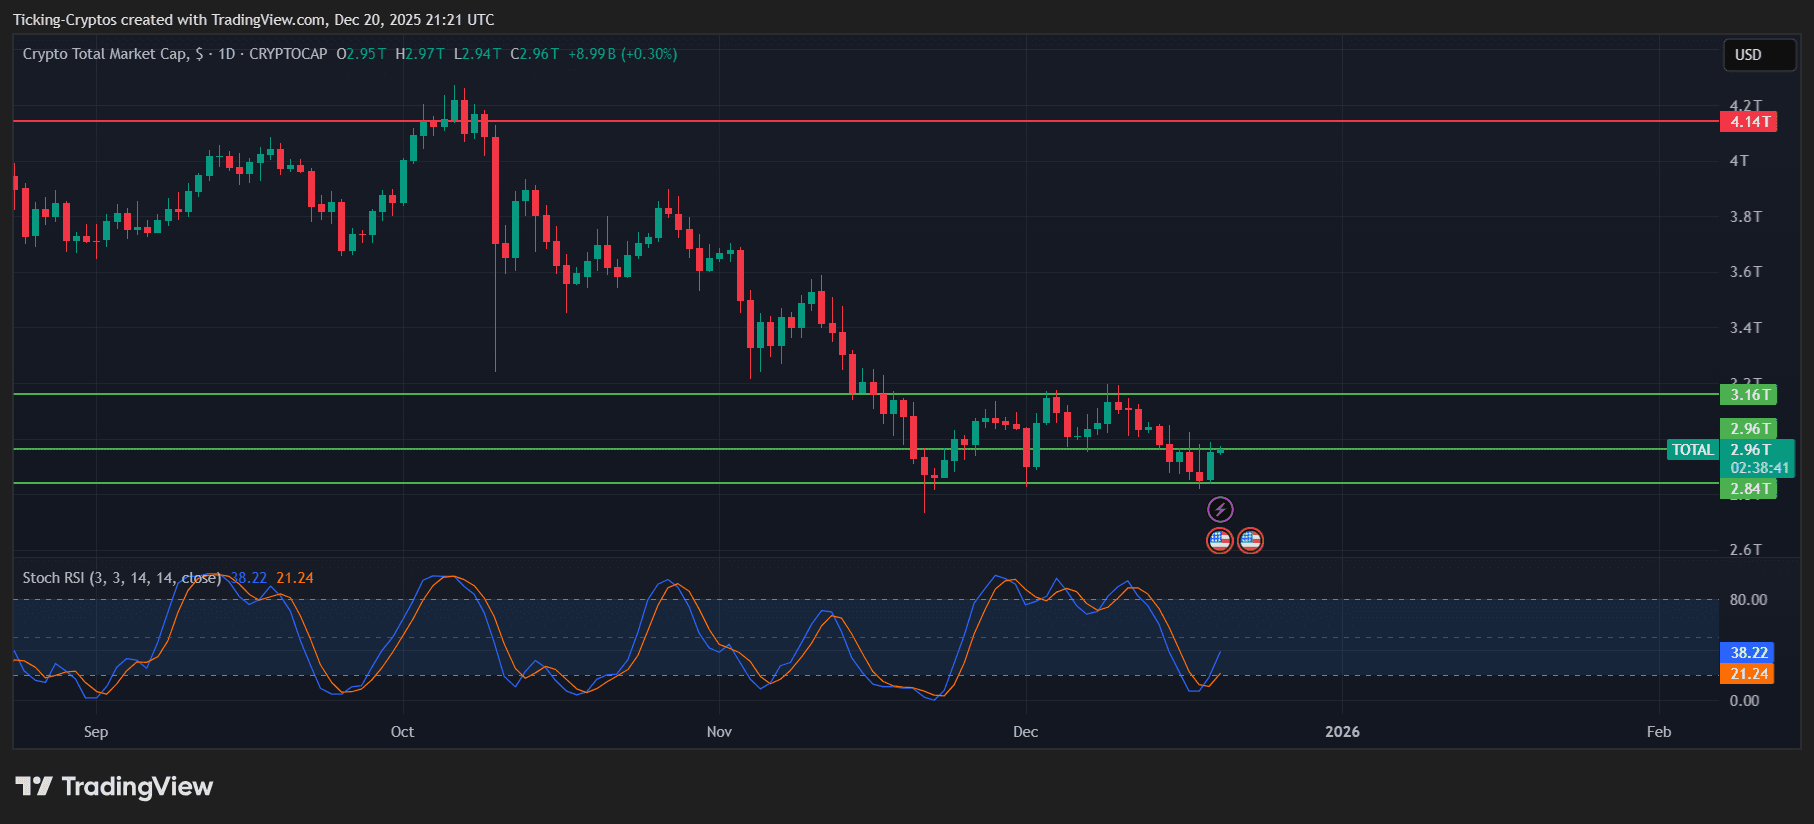
The total crypto market cap is currently hovering around $2.96 trillion, after a sharp correction from the cycle highs near $4.14 trillion. The recent price action shows that the market has entered a clear consolidation phase, rather than a full breakdown.
Total market cap in USD 1D chart - TradingView
The broader structure is now defined by:
- A strong rejection at the $4.14T resistance, marking the local market top
- A corrective move that found demand around $2.84T
- Ongoing consolidation between $2.84T and $3.16T
This range suggests the market is digesting gains from the previous expansion, with buyers and sellers currently in balance. Importantly, the market has not lost its higher-timeframe support, which reduces the immediate risk of a deeper crash.
Bitcoin (BTC) Price Analysis: Support Still Doing Its Job
$Bitcoin is trading around $88,000, holding above a key demand zone after a sharp correction from the $107K area.
What the chart shows:
- $BTC rejected hard from $107,500, confirming it as major resistance
- Current consolidation between $85,400 and $90,000
- Buyers are defending the $88K zone, but upside momentum is limited

BTC/USD 1D Chart - TradingView
Key Levels
- Support: $88,000 → $85,400 → $80,000
- Resistance: $90,000 → $92,500 → $107,500
BTC Outlook
- Bullish continuation only above $90K
- Breakdown risk increases below $85K
- For now, BTC remains range-bound
Ethereum (ETH) Price Analysis: Still Below Key Resistance
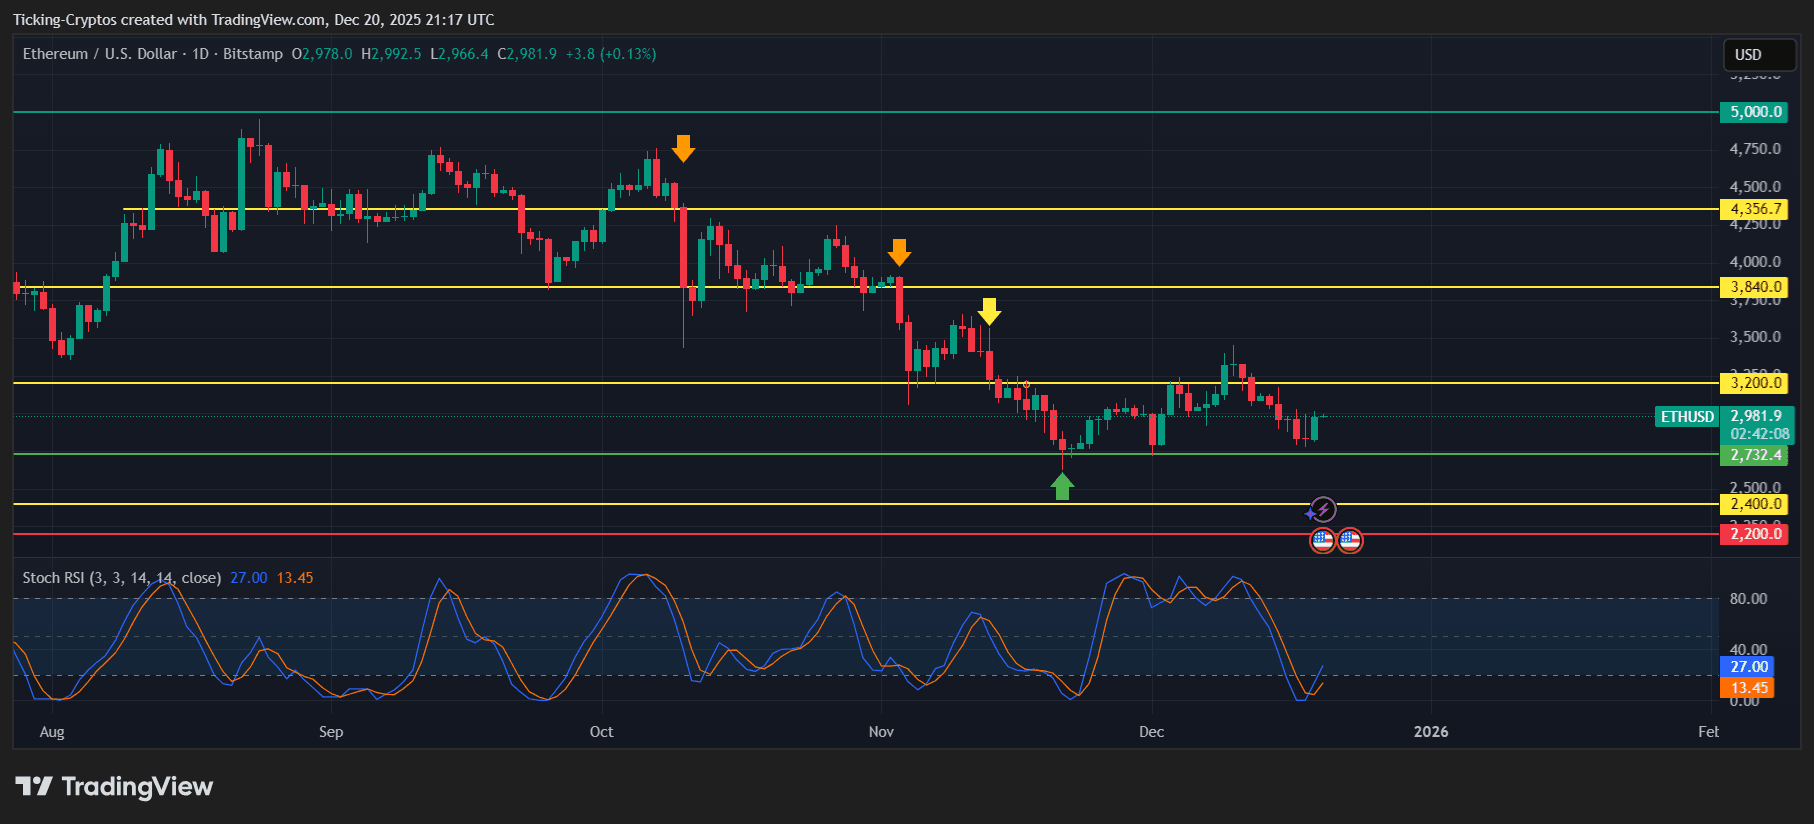
$Ethereum is trading near $2,980, struggling to regain higher levels after repeated rejections.
What the chart shows:
- Clear rejection from $3,840 and $4,356
- $ETH holding above $2,732, an important structural support
- Momentum remains weak but oversold conditions are forming
ETH/USD 1D Chart - TradingView
Key Levels
- Support: $2,732 → $2,400 → $2,200
- Resistance: $3,200 → $3,840 → $4,356
ETH Outlook
- A recovery above $3,200 would be the first positive signal
- Below $2,732, downside risk opens toward $2,400
- ETH still needs confirmation before turning bullish
Solana (SOL) Price Analysis: Under Pressure Near Demand Zone
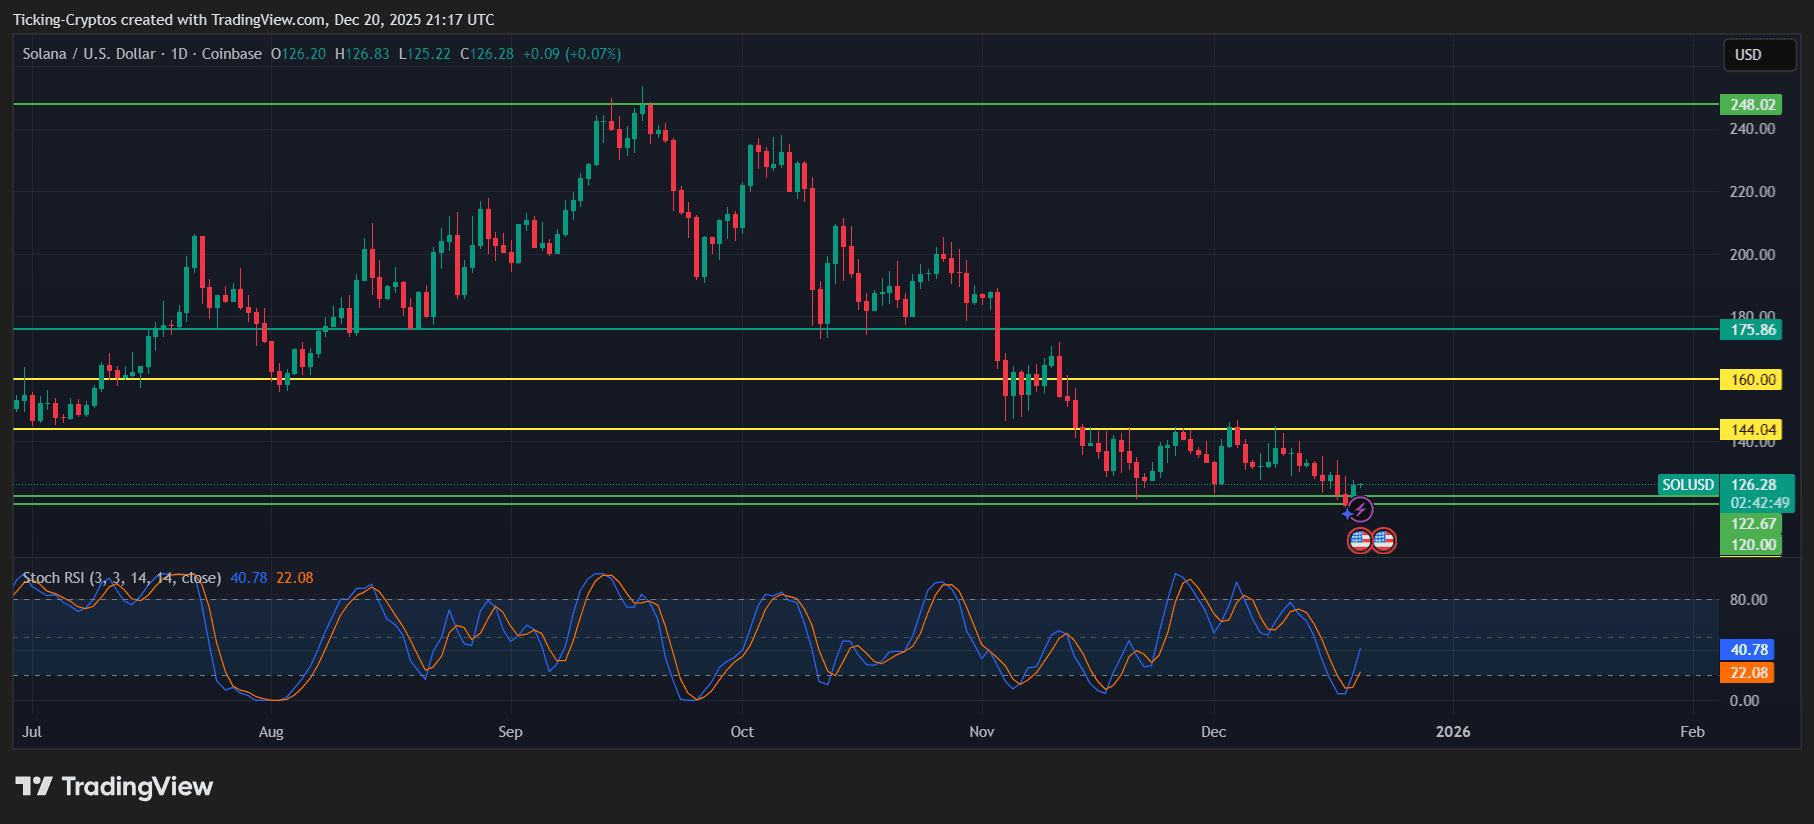
$Solana is currently trading around $126, sitting just above a critical support area.
What the chart shows:
- Strong rejection from $175 and $248
- Clean breakdown below $160
- Price consolidating near long-term demand
SOL/USD 1D Chart - TradingView
Key Levels
- Support: $122 → $120
- Resistance: $144 → $160 → $175
SOL Outlook
- Holding above $120 is crucial
- A bounce toward $144–$160 is possible
- Losing $120 would shift $SOL into a deeper correction
Dogecoin (DOGE) Price Analysis: Weak Structure Persists
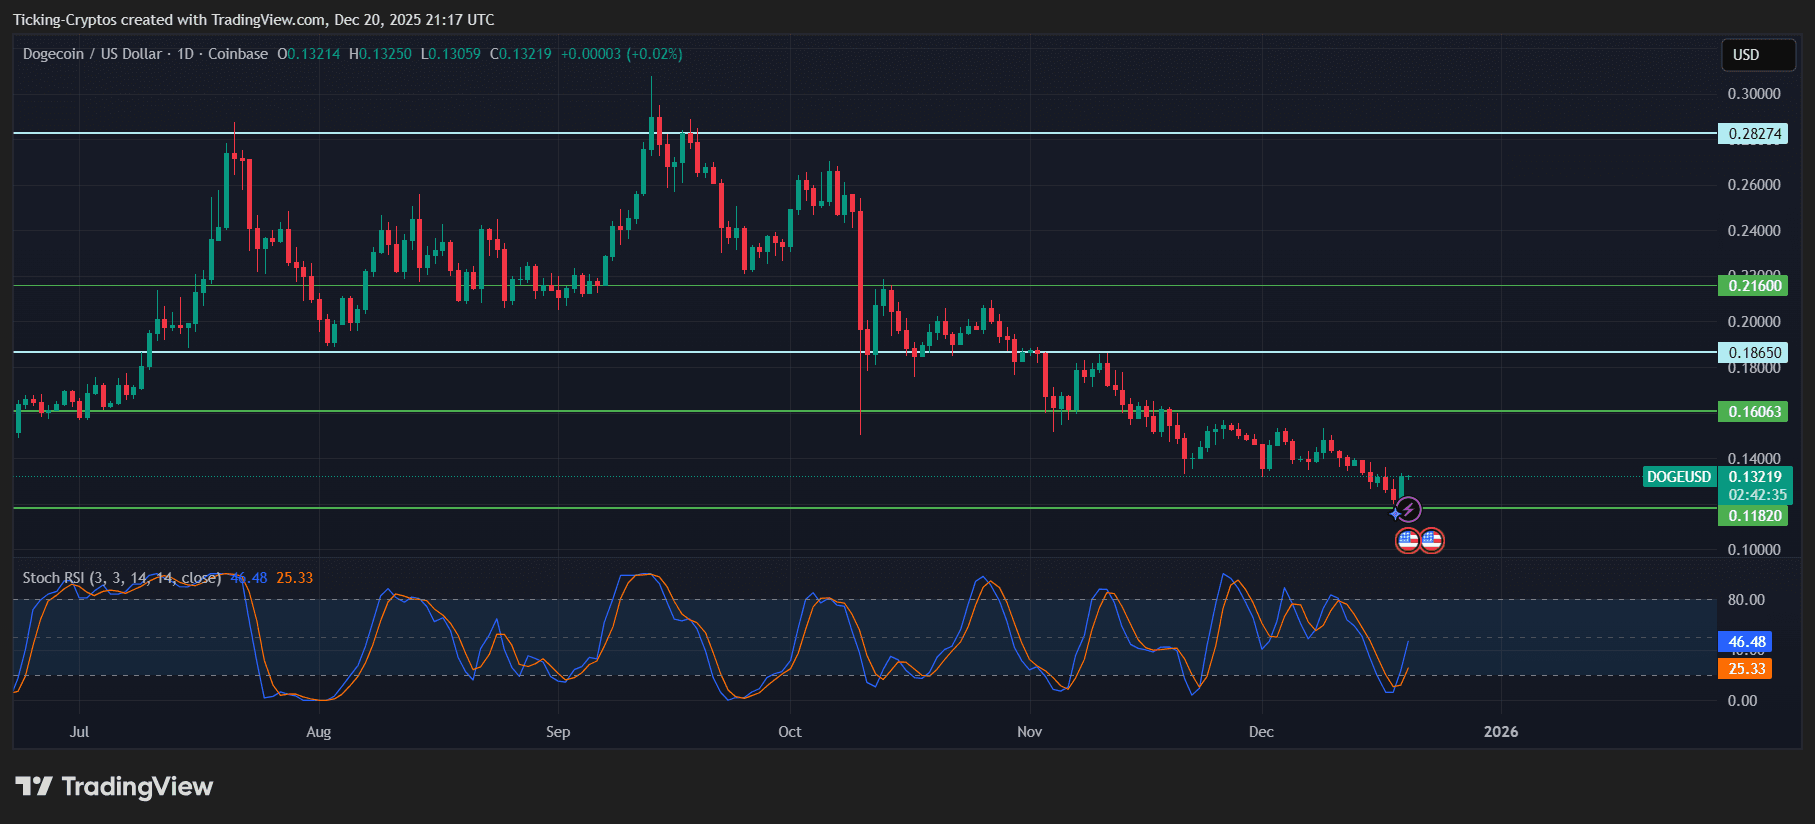
$Dogecoin is trading near $0.132, continuing to underperform relative to the market.
What the chart shows:
- Clear downtrend since the $0.28 highs
- Price now sitting just above $0.118, a key support
- Momentum remains weak with no bullish structure yet
DOGE/USD 1D Chart - TradingView
Key Levels
- Support: $0.118 → $0.10
- Resistance: $0.160 → $0.186 → $0.216
DOGE Outlook
- Only a move back above $0.160 would improve structure
- Below $0.118, DOGE risks another leg lower
- For now, $DOGE remains the weakest of the four