
Bitcoin Price Advances Cautiously, Bulls Probe for Upside Control

Bitcoin price found support and started a recovery wave above $88,000. BTC is now rising and might attempt to surpass the $89,000 resistance.
- Bitcoin started a recovery wave above the $88,000 zone.
- The price is trading above $88,000 and the 100 hourly Simple moving average.
- There is a bearish trend line forming with resistance at $88,750 on the hourly chart of the BTC/USD pair (data feed from Kraken).
- The pair might continue to move up if it trades above the $89,500 zone.
Bitcoin Price Faces Resistance
Bitcoin price managed to stay in a positive zone above $85,500 and started a recovery wave. BTC gained pace for a move above the $87,000 and $87,200 levels.
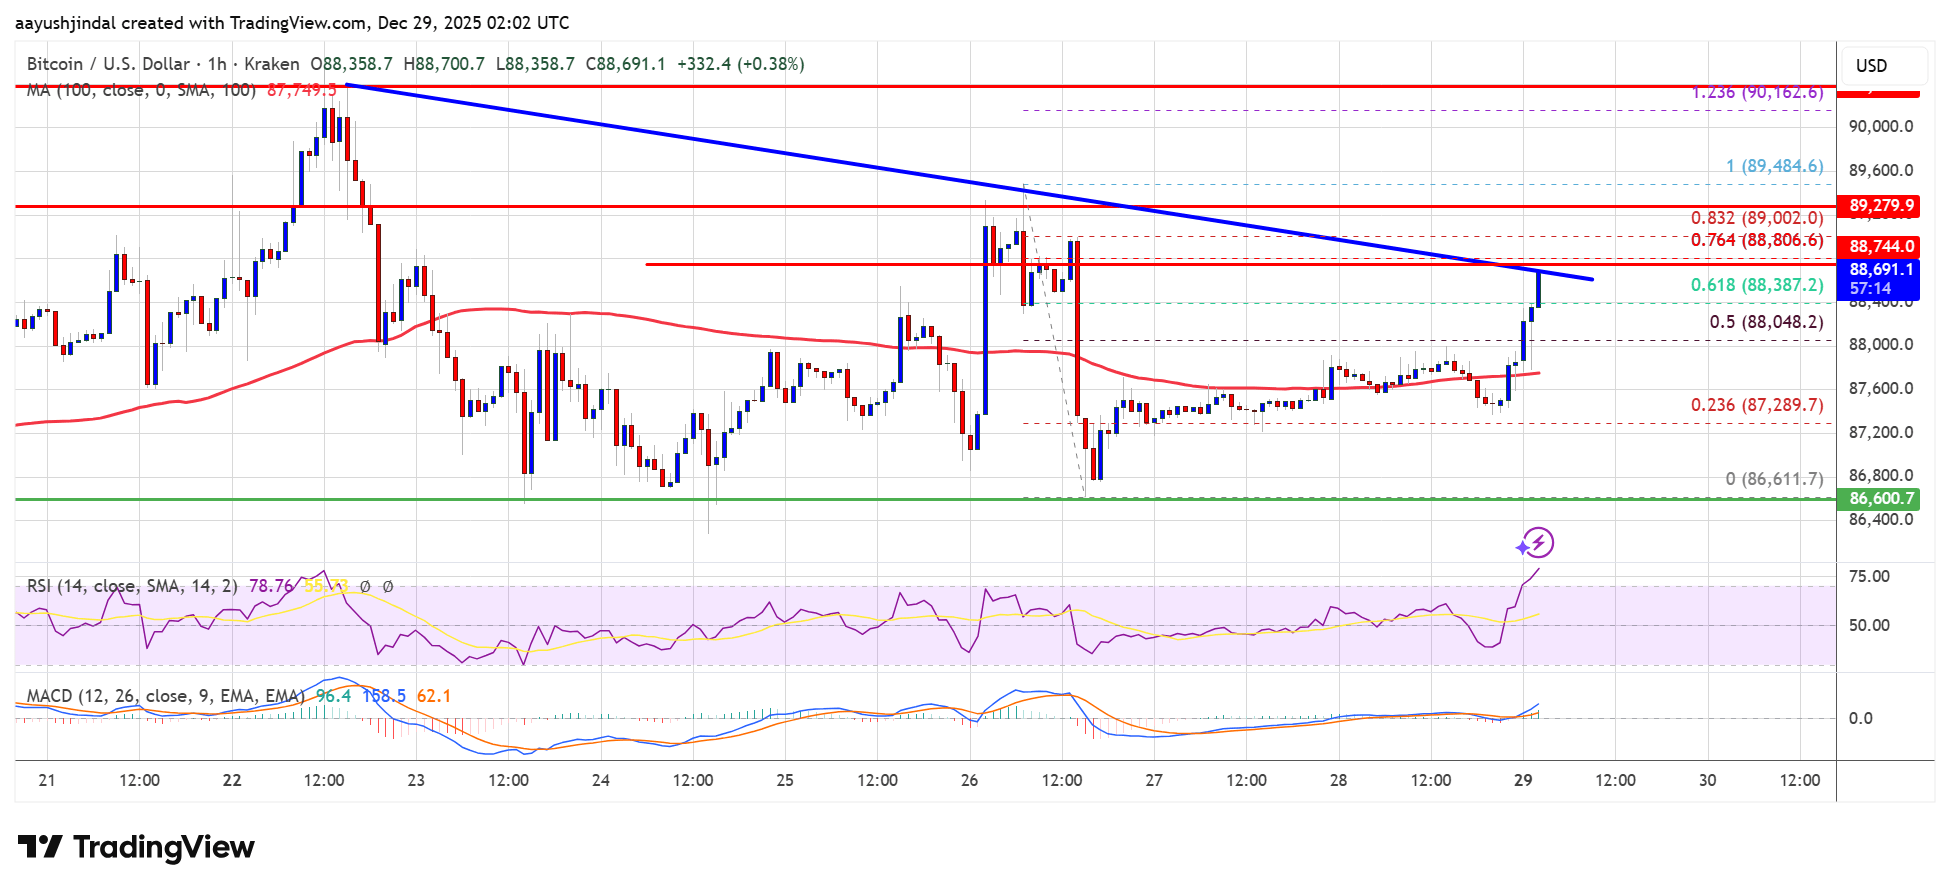
The price climbed above the 50% Fib retracement level of the downward move from the $89,484 swing high to the $86,611 low. The bulls even pushed the price above $88,000. Bitcoin is now trading above $88,000 and the 100 hourly Simple moving average.
If the price remains stable above $88,000, it could attempt a fresh recovery wave. Immediate resistance is near the $88,750 level and the 76.4% Fib retracement level of the downward move from the $89,484 swing high to the $86,611 low. Besides, there is a bearish trend line forming with resistance at $88,750 on the hourly chart of the BTC/USD pair.
 Source:
BTCUSD on TradingView.com
Source:
BTCUSD on TradingView.com
The first key resistance is near the $89,500 level. The next resistance could be $89,800. A close above the $89,800 resistance might send the price further higher. In the stated case, the price could rise and test the $90,200 resistance. Any more gains might send the price toward the $90,500 level. The next barrier for the bulls could be $91,500 and $92,000.
Another Decline In BTC?
If Bitcoin fails to rise above the $89,500 resistance zone, it could start another decline. Immediate support is near the $88,000 level. The first major support is near the $87,250 level.
The next support is now near the $86,500 zone. Any more losses might send the price toward the $85,500 support in the near term. The main support sits at $84,500, below which BTC might accelerate lower in the near term.
Technical indicators:
Hourly MACD – The MACD is now gaining pace in the bullish zone.
Hourly RSI (Relative Strength Index) – The RSI for BTC/USD is now above the 50 level.
Major Support Levels – $88,000, followed by $87,250.
Major Resistance Levels – $88,750 and $89,500.
Disclaimer: The content of this article solely reflects the author's opinion and does not represent the platform in any capacity. This article is not intended to serve as a reference for making investment decisions.
You may also like
Ethereum Price Prediction: ETH Compresses Near $3,000 As Triangle Tightens Into Year End
NVIDIA Snatches $5B Intel Stake as SEC Filing Confirms 214.8 Million Intel Shares Sold
Best Crypto Presales for 2026 Include DeFi Projects Like NovaYield and Wanna, but the One To Disrupt Crypto Finance Is DeepSnitch AI
FLOW Drops By Double Digits While Crypto Market Rallies—Here’s Why